INTRODUCTION
Carassius auratus is, ecologically warm-water teleost species, belonging to class Actinopterygii, family Cyprinidae, widely inhabited the lakes, brooks, rivers and marshes under the natural ecosystem throughout the northeastern Asia region in countries in China, Taiwan, Japan and Korea (Kim & Kang, 1993; Choi et al., 2002). The dorsal body color is yellowish brown and belly is a silvery-white tinged with brown. They have slightly long and flat to side body, a broad width of the caudal peduncle. As omnivores, they mainly eat a variety of feed/preys, such as aquatic insects, sessile diatoms, microscopic algae, debris, water plant and plankton. Crucian carp is ranked highest among the freshwater fishes in Korea as a game fish attracting millions of anglers owing to the quake of fingertips. In spite of the economic and scientific significance, the individuals of this fish species have decreased significantly owing mainly to imprudent development, reckless fishing and predation of introduced species during the last three decades. However, these kinds of crucian carp, which are recognized important morphometrically (Panicz et al., 2011), ecologically (Jo et al., 2011) as well as biochemically (Johnston & Maitland, 1980; Kim, 2015), are not molecular-biologically much researched like other finfishes. Only a few of information is known about the genetics of crucian carp in Korea (Yoon & Park, 2001; Hong et al., 2007). In general, there are marked differences of the size, color and body structure in common carp along with the environmental surroundings of habitat such as water temperature, feed, stress and nutrition, etc (Oh & Yoon 2014; Yoon 2015). We perform a clustering analysis to elucidate the genetic distances among four crucian carp populations from Hangang river, Geumgang river, Nakdonggang river and Yeongsangang river of the Korean Peninsula. Therefore, in this study, DNAs isolated from four crucian carp populations were analyzed by seven oligonucleotides primers with the aim of ascertaining the genetic distances by investigating their genetic similarity and diversity.
MATERIALS AND METHODS
Crucian carp ranged in size from 40 to 100 g (average 70 g) in body weight. The muscle obtained was frozen at –18°C until use. Muscle tissues were collected separately from Carassius auratus of a site of Hangang river (CAH), a site of Geumgang river (CAG), a site of Nakdonggang river (CAN) and a site of Yeongsangang river (CAY) of the Korean Peninsula, respectively. PCR analysis was performed on DNA samples extracted from a total of 20 individuals using seven oligonucleotides primers (Yoon & Park, 2006). DNA extraction was carried out according to the separation and extraction methods (Song & Yoon, 2013). After several washings, lysis buffer I (155 mM NH4Cl; 10 mM KHCO3; 1 mM EDTA) was added to the samples, and the mixture tubes were lightly inverted. Ice-cold 70% ethanol was added, and then the samples were centrifuged at 19,621 g for 5 minutes to extract the DNA from the lysates. The concentration of the extracted genomic DNA was measured with the absorbance ratio at 260 nm by a spectrophotometer (Beckman Coulter, Buckinghamshire, UK). The DNA pellets were incubation-dried for 2 hrs, held at –40°C until analysis and then dissolved in the TE buffer (10 mM Tris-HCl, pH 8.0; 1 mM EDTA). The amplification reaction was undertaken in a 20 μL volume of reaction tube containing 10 ng of template DNA, 20 μL AccuPower premix (Bioneer Corp., Daejeon, Korea) and 1.0 unit primer (Bioneer Corp., Daejeon, Korea). Amplification products were separated by electrophoresis in 1.4% agarose gels (Bioneer Corp., Daejeon, Korea) with TBE (0.09 M Tris, pH 8.5; 0.09 M borate; 2.5 mM EDTA), using 100 bp DNA ladder (Bioneer Corp., Daejeon, Korea) as DNA molecular weight marker and detected by staining with EtBr. All of these oligonucleotides primers had G+C content in the range 60–70%. Seven oligonucleotides primers, BION-02 (5’-CAATCGCCGT-3’), BION-03 (5’-AGGGGTCTTG-3’), BION-09 (5’-GGGTAACGCC-3’), BION-10 (5’-CTGAG ACGGA-3’), BION-12 (5’-TACAACGAGG-3’), BION-14 (5’-TGGATTGGTC-3’) and BION-19 (5’-GTCCACA CGG-3’) were used to produce the unique shared loci to each population and shared loci by the four populations of Carassius auratus which could be counted. PCR was carried out using Programmable DNA Thermal Cycler (MJ Research Inc., Waltham, MA, USA). Similarity matrix containing bandsharing values (BS) between different individuals in Carassius auratus was calculated along with the procedures of Jeffreys & Morton (1987) and Yoke-Kqueen & Radu (2006). A hierarchical clustering tree was constructed using similarity matrices to produce a dendrogram, using the Systat version 10 (SPSS Inc., Chicago, IL, USA).
RESULTS AND DISCUSSION
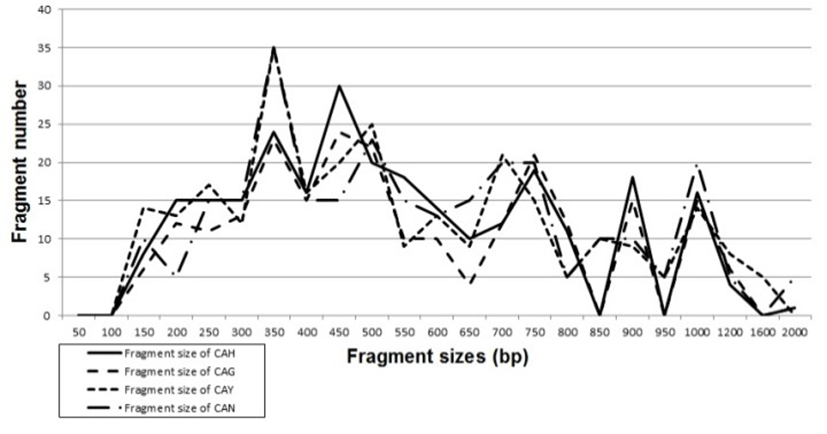
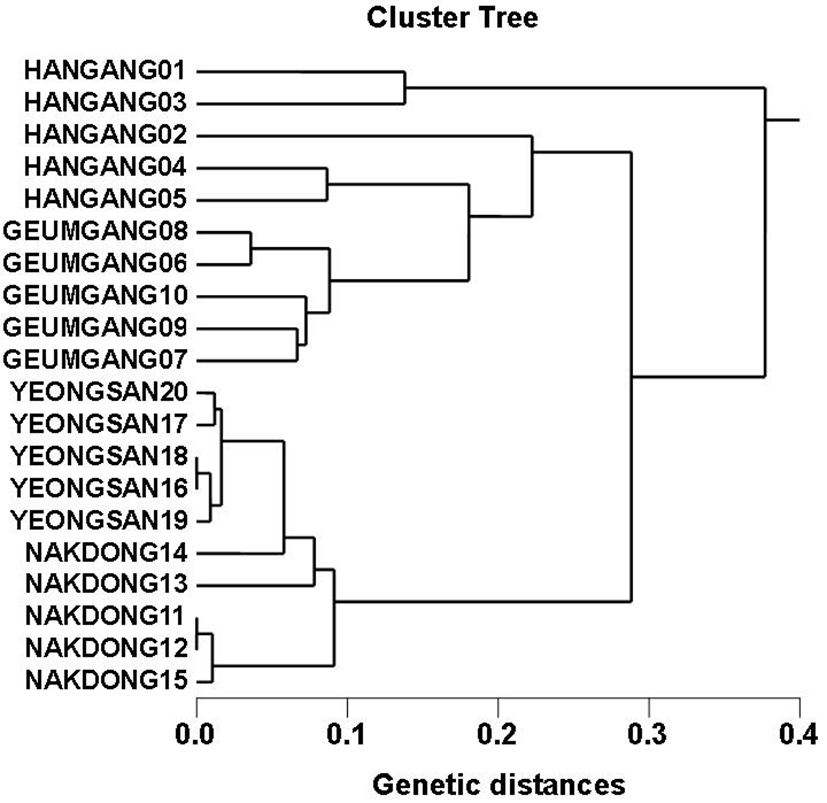
Genomic DNAs isolated from Carassius auratus obtained in Hangang river (CAH), Geumgang river (CAG), Nakdonggang river (CAN) and Yeongsangang river (CAY) were amplified at several times by PCR reactions. The amplified products were separated by agarose gel electrophoresis (AGE) with oligonucleotide primers and detected by staining with ethidium bromide. The hardship of the banding patterns was diverse between the primers and four populations (Fig. 1). Consequently, in the present study, the size of the DNA fragments, ranged from 150 to 2,000 bp. The higher fragment sizes (>1,000 bp) are much more observed in the CAN population, as shown in Fig. 1. The bandsharing value between individuals no. 11 and no. 12 was 0.998, which was the highest value identified within the CAN population. The seven oligonucleotides primers produced 16.7 average no. per primer specific to the CAH population, 7.4 in the CAG population, 8.6 in the CAN population and 0.9 in the CAY population, respectively, as illustrated in Table 1. The primer BION-12 generated the most loci (a total of 50) with then average of 10 in the CAY population. The primer BION-19 generated the most loci (a total of 43) with the average of 8.6 in the CAG population. The oligonucleotides primer BION-10 generated the least loci (a total of 19), with the average of 3.8 in the CAG population, in comparison to the other primers used. Six specific loci, with the average of 39.4 per primer, were identified in the CAY population. Fifty two specific loci, with the average of 33.1 per primer, were identified in the CAG population, as demonstrated in Table 1. The specific loci generated by oligonucleotides primers revealed inter-individual-specific characteristics, thus disclosing DNA polymorphisms. Many researchers studied the sizes of DNA fragments in the PCR profiles of crucian carp (Carassius auratus) methods (Yoon & Park, 2006; Takada et al, 2010) and Japanese crucian carp (Carassius cuvieri ) (Hong et al., 2007). Here, the seven oligonucleotide primers were used to generate the unique shared loci to each population and shared loci by the four populations. Especially, 420 numbers of shared loci by the four populations, with an average of 60 per primer, were observed among the four populations, as illustrated in Table 2. Interestingly, the primer BION-19 detected 100 shared loci by the four populations, major and/or minor fragments of sizes, which were identical in almost all of the samples. Especially, the oligonucleotides primer BION-02 generated 5 unique loci to each population, which were identifying each population in the CAH population. Also, the oligonucleotides primer BION-12 generated 50 unique loci to each population in the CAY population. Concerning average bandsharing value (BS) results, individuals from CAY population (0.985±0.009) exhibited higher bandsharing values than did individuals from CAH population (0.779±0.049) (P<0.05), as illustrated in Table 3. In the present study, the dendrogram obtained by the seven oligonucleotides primers indicates four genetic clusters: cluster 1 (HANGANG01 ∼ HANGANG05), cluster 2 (GEUMGANG06 ∼ GEUMGANG10), cluster 3 (NAK DONG11 ∼ NAKDONG15) and cluster 4 (YEONGSAN16 ∼ YEONGSAN20), as shown in Fig. 2. The shortest genetic distance that displayed significant molecular differences was between individuals no. 16 and no. 18 from the CAY population (genetic distance = 0.002), while the longest genetic distance among the twenty individuals that displayed significant genetic differences was between individuals no. 03 and no. 05 from the CAH population (genetic distance = 0.377). The genetic distance that exhibited significant molecular differences was between individuals no.06 and no.08 from the CAG population (genetic distance = 0.036), while the genetic distance among the five individuals that exhibited significant molecular differences was between individuals no.08 and no.09 from the CAG population (genetic distance = 0.088). Relatively, individuals of CAY population were properly closely related to that of CAN population (genetic distance between two populations<0.016), as shown in the hierarchical dendrogram of genetic distances, as exposed in Fig. 2. PCR fragments revealed in the present study may be valuable as a DNA marker. The potential of amplified specific DNAs to identify diagnostic markers for species, locality and population identification in crucian carp (Yoon & Park, 2001; Hong et al., 2007; Cheng et al., 2012) has also been well established. Crucian carp of four populations can be clearly distinguished by PCR-based approach. As mentioned above, this method can also be applied to other habitat of crucian carp and make technically- convenient the analysis of many samples. Using diverse oligonucleotides primers, this PCR analysis has been applied to identify polymorphic/specific markers particular to line, species, genus and geographical population, as well as genetic diversity/polymorphism in various species of organisms (Tassanakajon et al., 1998; McCormack et al., 2000; Yoon & Kim 2004; Oh & Yoon 2014; Yoon 2015). Preferentially, the habitat classification of genus Carassius is based on morphological variations in fin shape, body color, length and weight besides PCR analysis. In future, further research is necesarry for more profound population identification in crucian carp.


| Population | CAH | CAG | CAN | CAY |
|---|---|---|---|---|
| CAH | 0.779±0.049d | 0.739±0.040c | 0.632±0.021a | 0.645±0.024a |
| CAG | - | 0.851±0.037f | 0.650±0.033a | 0.682±0.018b |
| CAN | - | - | 0.887±0.079g | 0.814±0.031e |
| CAY | - | - | - | 0.985±0.009h |
