INTRODUCTION
Olive flounder (Paralichthys olivaceus) is representative species of seawater farmed fish in Korea, which accounts for approximately 50% of the annual production of fish. For the aquaculture of olive flounder, artificial seed production research began since 1982 in Geoje Fisheries Hatchery Station, National Fisheries Research & Development Institute (current Genetics & Breeding Research Center, National Fisheries Research & Development Institute). Embryos were obtained by adaptation in the land tank of natural spawning from wild flounder fertilized eggs since 1985 and can supply artificial seed technology and embryo. Jeju Island and Busan kijang, the water temperature is relatively high region in the winter began greatly increased the land tank aquaculture of olive flounder since the late 1980s and currently is being made across the country in Jeju Island and Wando. Started from a minority group in the 1980s, however, olive flounder aquaculture for over 30 years throughout several generations of inbreeding consists of genetic diversity being reduced, slowdown in growth, disease and environmental resistance degradation (Carvalho & Haeser, 1994) as well as reported with the change of the body shape (National fisheries research & development institute, 2006). To solve genetic problems of the domestic olive flounder aquaculture, Genetics & Breeding Research Center cultured in 2004 from 2003 with the introduction of a wild mother group. As a result, olive flounder was improved growth rate and body shape and disseminated from 2010 in the field.
Morphological traits of the group may be determined by the innate genetic change as well as acquired factors such as the external environment (Parrish & Saville, 1965; Myeong, 1992; Geng et al., 2000). Genetic methods in order to identify the characteristics of the group (Yoshida et al., 2000; Sekino et al., 2002; Hara & Sekino, 2003; Liu et al., 2005; Jeong et al., 2009) are used, but a lot of morphological methods are also very useful (McClure & Wickston, 1997; Resenberg, 2002; Her et al., 2006). Although morphological study may be the basis in the molecular biological studies of olive flounder, morphological research for the appearance was unknown until now. Therefore, the comparison of the phenotypic traits of wild and farmed olive flounder populations need to perform morphological studies. In this study, we were collected and measured wild and farmed olive flounder in several areas in order to provide basis data for improved domestic aquaculture.
MATERIALS AND METHODS
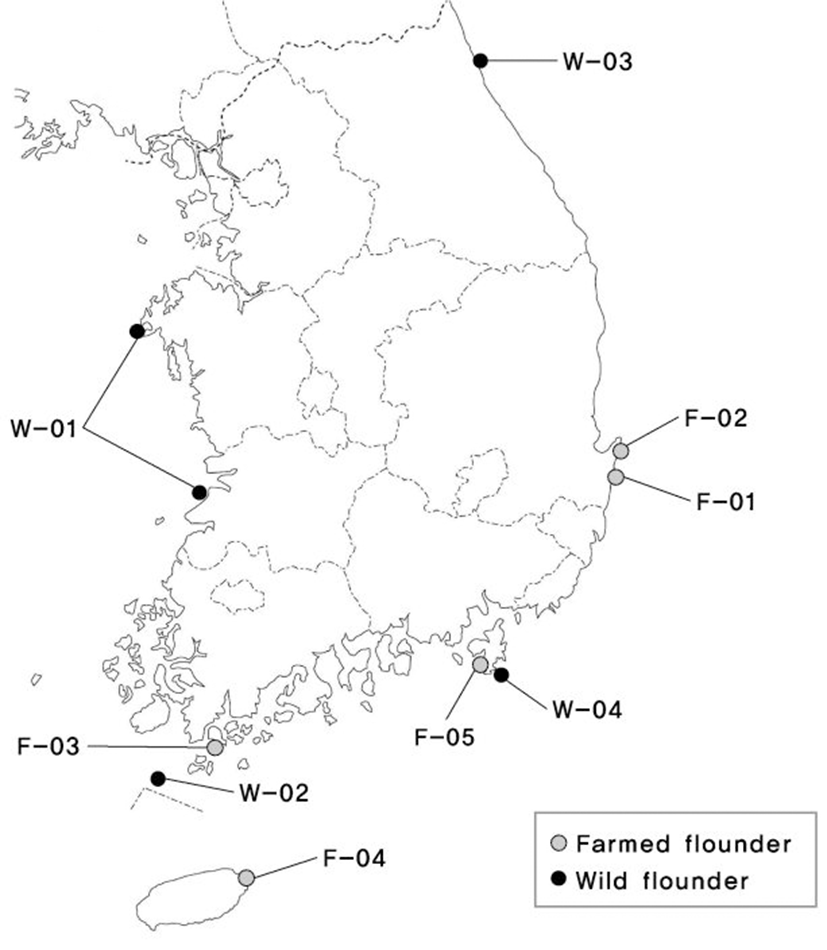
A lot of 1,095 adult olive flounder specimens, based on a total of four populations from wild and five populations from farms were collected. Geographic locations, sample sizes, and nomenclature are given in Fig. 1 and Table 1.
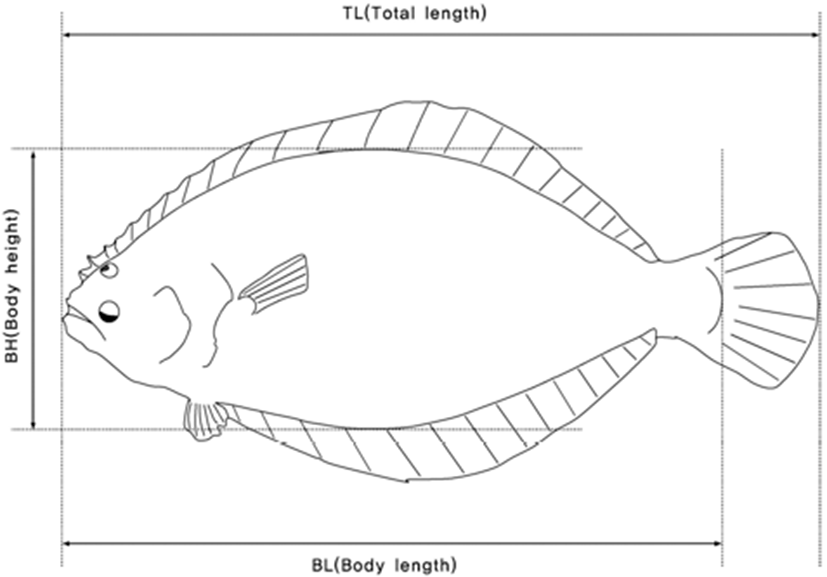
Phenotypic data were recorded on four quantitative traits of wild and farmed populations of olive flounder (Fig. 2). These evaluations comprised body weight (BW in g), total length (TL in cm), body length (BL in cm), and body height (BH in cm). In addition, body shape index (BSI), condition factor (CF), and body length ratio (BLR) were calculated by the following equation:
To assess the trait variability and the significant differences within and between populations, analysis of variance (ANOVA) was performed using the software SAS version. 9.2 (SAS Institute, Cary, NC, USA). The character means were compared using the least significant differences (LSD) test at the 5% probability level. Furthermore, Pearson correlation coefficients were calculated using all investigated traits by SAS.
RESULTS
Morphological analysis of olive flounder showed that surveyed traits and standard deviation were 1,355±742 g of body weight, 48.01±7.79 cm of total length, and 40.96±6.80 cm of body length. And body height, body shape index and condition factor were 17.19±3.43 cm, 9.99±0.74 and 11.16±1.54, respectively (Table 2). BW (body weight; g), TL (total length; cm), BL (body length; cm), BH (body height; cm), BSI (Body shape index), and CF (Condition factor) of wild and farmed populations of olive flounder are given in Table 3. As result of least squares mean and standard error for each trait assumed in this study, those of farmed population showed significantly higher than those of wild population in all traits, exclusively in total length and body length (p<0.01). Particularly, two-factor anova (type III sums of squares) revealed that while farmed olive flounder (BW=1556.0±15.2 g; mean±95%CI) were significantly higher than wild (mean TL=1351.2±19.8 g), there were no significant differences in mean TL and BL. Table 4.
| Source | BW (g) | TL (cm) | BL (cm) | BH (cm) | BSI | CF |
|---|---|---|---|---|---|---|
| Overall mean | 1,355.4 | 48.01 | 40.96 | 17.19 | 9.99 | 11.16 |
| Standard deviation | 742.4 | 7.79 | 6.80 | 3.43 | 0.74 | 1.54 |
| Source | BW | TL | BL | BH | BSI |
|---|---|---|---|---|---|
| TL | 0.944 | ||||
| BL | 0.941 | 0.995 | |||
| BH | 0.943 | 0.926 | 0.917 | ||
| BSI | 0.458 | 0.313 | 0.300 | 0.645 | |
| CF | 0.478 | 0.239 | 0.234 | 0.481 | 0.741 |
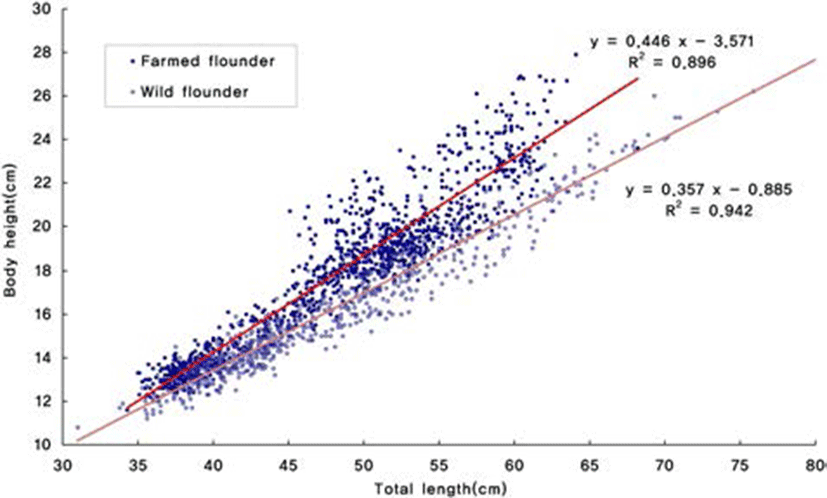
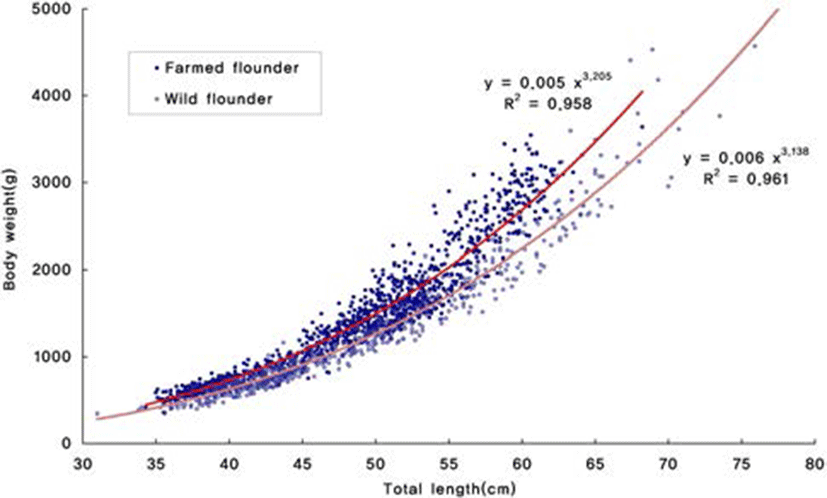
To determine the proportion of variation associated with differences in morphology, the two principal components were regressed against body height and body weight of each individual. PC2 was positively correlated with total length of all populations of olive flounder. Body height of wild and farmed populations of olive flounder linearly (P<0.05) increased with a increase in total length: Y (body height)=0.446×(total length) 3.571 (R2=0.896) and Y (body height)=0.357(total length)– 0.885 (R2=0.942) (Fig. 3), respectively. In addition, body weight of wild and farmed populations of olive flounder linearly (P<0.05) increased with a increase in total length: Y (body weight)=0.005(total length)3.205 (R2=0.958) and Y (body weight)=0.006(total length)3.138 (R2=0.961) (Fig. 4), respectively.
Next, correlations between phenotypic traits were estimated. Traits recorded in wild and farmed olive flounder were BW (body weight; g), TL (total length; cm), BL (body length; cm), BH (body height; cm), BSI (Body shape index), and CF (Condition factor). Phenotypic correlations between BW and TL, BW and BL, BW and BH, TL and BL, TL and BH, and BL and BH were 0.944, 0.941, 0.943, 0.995, 0.926, and 0.917, respectively. These results showed that these traits were strongly related to each other. Strongly unfavourable phenotypic correlations were also obtained between TL and BSI (0.313) or CF (0.239).
DISCUSSION
The olive flounder is accounted for more than half of the domestic fish production and it is valued as the most competitive export species to the world market in the future. To improve the productivity and quality of olive flounder, research has been actively conducted for major economic traits in feed efficiency, growth and disease resistance (Sizemore & Siegel, 1993; Gjedrem, 2000; Fjalestad et al., 2003; Kim et al, 2008; Kim et al, 2011).
Growth-oriented aquaculture of olive flounder was induced inbreeding since the start until now, and reduction of genetic diversity leads to decrease of growth and immunity and body shape changes. Japanese consumers prefer to olive flounder that fat-rich fin part and elliptical shape in the interview survey by the Korea exporters, on the other hand, Japanese buyers were likely to focus screening criteria such as shape, color and size (Korea maritime institute, 2005). Because body type is an important trait in Japan as well as in the world market, comparison of the group and regional body type between wild and farmed olive flounder was able to basic data for the improvement of farmed flounder body type.
In this study, coefficients of the growth-related traits such as body weight, total length and body length are higher in farmed olive flounder, it suggested that just one of the growth traits can be obtained the improved effect of the addition of other growth traits. However, correlation between the body weight and body index, total length and body index appeared somewhat lower, therefore should be considered appropriate weighted value of the body index for improvement of body type in the selection process of mother. Farmed and wild flounder were similar to total length and body length, but, in shape, body height and shape index of farmed flounder were significantly higher than those of wild flounder.
The regional population analysis of farmed and wild flounder showed that most farmed group were classified as high-body index, whereas all four wild group were classified as low-body index. These results suggested that morphological differences exist in farmed and wild flounder. Therefore, introduction of wild flounder is essential for the future production to improve the body type of farmed flounder, and parental fish should be chosen by considering commercial important traits such as growth, disease, environmental resistance, and feed efficiency in the production process. In addition, morphological studies should be made consistently for improving body type and export to Japan and the world market of olive flounder.