INTRODUCTION
Olive flounder (Paralichthys olivaceus) is one of the most important fish species and constitutes more than 50% of the total fish community biomass. Hence, it plays an important role in aquaculture and fisheries in Korea. In most oviparous fish, including olive flounder, larval survival depends upon the timely development of the feeding organs. The flounder undergoes a number of developmental changes during its larval stage, and eyesight is probably the most important sense with respect to the search for prey in all of these developmental stages (Cook, 1996; Francis & Turingan, 2008). Immature eye development results in a delay in the introduction of food, resulting in starvation of fish larvae, eventually leading to the death of the larvae. In the case of natural populations, the pelagic larvae migrate to shallow waters and settle on the seabed. Subsequently, certain morphological changes occur that transform the body from a symmetrical to an asymmetrical form. These changes include the relocation of one eye and pigmentation of one side (Miwa & Inui, 1987; Miwa et al., 1988; Yamano et al., 1991). Extensive research has been performed on flatfish metamorphosis in order to elucidate the mechanisms involved in such dramatic changes in morphological features(Yamano et al., 1994; Yamano & Miwa, 1998). However, very few molecular studies have been conducted to unravel the molecular mechanisms involved in the early stages of ocular development. Hence, the screening and identification of genes expressed in the eye will provide useful insights into the mechanisms underlying the molecular regulation of ocular development in olive flounder. Furthermore, knowledge of the expression patterns of these genes can also provide important information about their functional interactions within the eye.
Ocular development of olive flounder is derived from the surface ectoderm. However, the retina and the epithelial layers of the iris and ciliary body originate from the anterior neural plate. Therefore, suitable expression of ocular development-related gene is important for the overall correct organization of the various eye components. Various studies have been performed to establish the complex processes involved in the development of the ocular systems in zebra fish, mice, and humans (Easter & Nicola, 1996; Martinez & Bolker, 2003). Histological investigations of many species have shown the presence of a differentiated retina containing photoreceptors and the development of neural connections to the optic tectum by the time of feeding (Gibb, 1995; Liem et al., 1985). However, behavioral estimates of visual acuity are lower than those gained by anatomical assessment of photoreceptor density in larval fish (Shand et al., 1999). The ability of larval fish to use eyesight to capture prey depends on the development of the optical elements of the eye and the synaptic connections between the neurons of the retina and their connections in visual brain centers (Rahmann et al., 1979; Schmitt & Kunz, 1989).
The visual system of vertebrates is effective over a wide range of light intensities as it involves different types of photoreceptor cells. Rod photoreceptors are exceptionally light sensitive, with their transduction cascade being tuned for maximal quantum yield. Cone photo-receptors are less sensitive but allow for vision with high temporal and spatial resolution, which necessitates fast response kinetics (Kawamura & Tachibanaki, 2008). In the rod photo transduction cascade, phosphorylation of photo excited rhodopsin reduces the efficacy of transducin activation (Burns & Arshavsky, 2005; Lamb & Pugh, 2006; Fu & Yau, 2007). Subsequent high-affinity binding of the arrestin protein to activated and phosphorylated rhodopsin completely quenches signal transduction by competing with the G-protein transducin for rhodopsin binding (Krupnick et al., 1997). The binding of arrestin to the phosphorylated activated receptors quenches signal transduction via its apparent ability to directly decrease G-protein receptor coupling (Lohse et al., 1990; Wilden et al., 1986). Arrestin was originally identified as a soluble protein present in the bovine retina in abundance. Subsequently, visual arrestin homologues have been identified in many species, and, in addition, numerous arrestins have been found in non-retinal tissue. It has been established that both retinal and non-retinal arrestins mediate the inactivation of G protein-coupled receptors (Ferguson et al., 1996; Goodman et al., 1996). This finding has suggested a common mechanism for desensitizing this large class of receptor molecules. On searching through an olive flounder DNA database of expressed sequence tags (ESTs), we identified a partial sequence, similar to that of arrestin. However, the temporal expression patterns of the arrestin gene during the developmental stages and in other tissues of olive flounder remain unknown. The purpose of this study was to identify the genes expressed during ocular formation in the developmental stages of olive flounder.
MATERIALS AND METHODS
All experimental fish were raised at Genetics and Breeding Research Center, National Fisheries Research and Development Institute (NFRDI) and maintained in 10 tons flow through tank at 20±1°C under a natural photoperiod. Different stages of embryo (0.92±0.02 mm), larvae (2.49±0.34 mm) and juvenile (3.5±0.45 mm) development were described from fish kept at 20°C in the tank. Several tissues of 60 days (4 cm±SEM), 10 month (14 cm ±SEM) and 2 years (38 cm±SEM) old were used to in olive flounder. The samples of 10 fish were randomly collected and frozen in 70°C deep freezer until isolation of total RNA. Pooled eye tissues were homogenized for 20 sec with Trizol reagent (Invitrogen, Carlsbad, CA, USA).
Larvae were examined as previously described, fixed at room temperature, in 2.5% glutaraldehyde (Polysciences, Inc., Warrington, PA) in 0.1 M sodium cacodylate-HCl buffer, pH 7.3, for 10 min, and post fixed in 1% OsO4 (Sigma-Aldrich, CA, USA) in the same buffer, for 20 min with 1% uranyl acetate for 1 h and ethanol dehydration. The samples were examined under a stereo microscope (ZEISS CL1500 ECO Jena, Germany) imaging system at ×400 magnification of development was determined.
Bioinformatic analysis was conducted to determine gene identities using Gene Master software (Ensoltek, Beaverton, USA). ESTs were assembled in clusters of contiguous sequences (conting) using ICA tools program (Parsons, 1995). Gene annotation procedures and homology searches of the sequenced ESTs have been locally done by BLASX for amino acid similarity comparisons. Matches with the Expect value (E) less than 1.0 × e–4 were considered to be significant, all ESTs were not identified as orthologs of known genes were designated as unknown EST clones. The trans-membrane secondary structure prediction program was used to TMRPres2D tool (Athens, Greece).
Total RNA was extracted using the Trizol Reagent (Invitrogen, Carlsbad, CA, USA) according to the manufacturer's protocol. DNase-I (Sigma-Aldrich, CA, USA) was treated for removing genomic DNA contamination from RNA for 30 min at 37°C. The RNA samples were extracted with phenol/chloroform to inactivate the DNase I. RNA concentration was measured with spectrophotometer (Gene-Quant, Pharmacia Biotech), quality of RNA was checked by gel electrophoresis (1% agarose gel) and stored at –80°C until further use. RNA (100 ng) from each sample was transcribed to cDNA using Transcriptor First Strand cDNA synthesis kit (Roche Ltd., SWISS). The amplification was performed with AmpliTag Gold DNA Polymerase (Applied Biosystems., CA, USA) and My cycler Thermal Cycler (Bio-Rad Laboratories Inc., Hercules, CA, USA) using the following parameters: denaturation at 95°C for 10 minutes and 35 cycles of reactions of denaturation at 98°C for 10 s, annealing at 58°C for 30 s, and elongation at 72°C for 45 s. An aliquot of each PCR product was subjected to 1.5% (w/v) agarose gel electrophoresis and visualized by staining with ethidium bromide. The 5′ forward and 3′ reverse-complement PCR primers for amplification of each gene were as follows: Arrestin (5'-CAATGTGCCGTGGAGTTTGA-3') and (5'-CCCCGGTGGTAGTACA TCTC-3'), β-Actin (5'-TGATGAAGCCCAGAGCAAGA-3') and (5'-CTCC ATGTCATCCCAGTTGG-3'. Relative amount of each messenger RNA was quantified by dividing by density of housekeeping gene (Gene bank, HQ 386788.1).
To evaluate arrestin mRNA levels, these primers were specifically designed to detect and quantify cDNA sequences without detecting genomic DNA. The Fast-Start DNA Master SYBR Green I (Roche Ltd., SWISS) was used as fluorescent reporter dye to detect amplification products in 7500 Fast Real Time PCR System (Applied Biosystems Inc. Carlsbad, CA, USA) using the following cycling conditions: denaturation at 95°C for 10 min and 40 cycles of reactions of denaturation at 95°C for 10 s, annealing at 60°C for 30 s, and elongation at 72°C for 30 s. Each sample was tested in triplicate to ensure statistical significance. The PCR efficiency (E%) of gene was derived from arrestin (95.3%) and β-Actin (94.3%) respectively. The relative quantification of arrestin gene expression was performed using the comparative Ct method. The Ct value is defined as the point where a statistically significant increase in the fluorescence has occurred. The number of PCR cycles (Ct) required for the ROX intensities to exceed a threshold just above background was calculated for the test and reference reactions. In all experiments, β-Actin was used as the endogenous control. Results were analyzed in a relative quantitation study with the vehicle treated.
Data were analyzed using Sigma plot for Windows (Jandel Scientific, San Rafael, CA, USA). For unpaired matched comparative analysis of multiple groups, an analysis of variance (ANOVA) was performed. Data that did not meet normality assumptions were subjected to Kruskal-Wallis ANOVA on ranks, and then pair wise comparisons were made using the Student-Newman-Keuls (SNK) method.
RESULTS
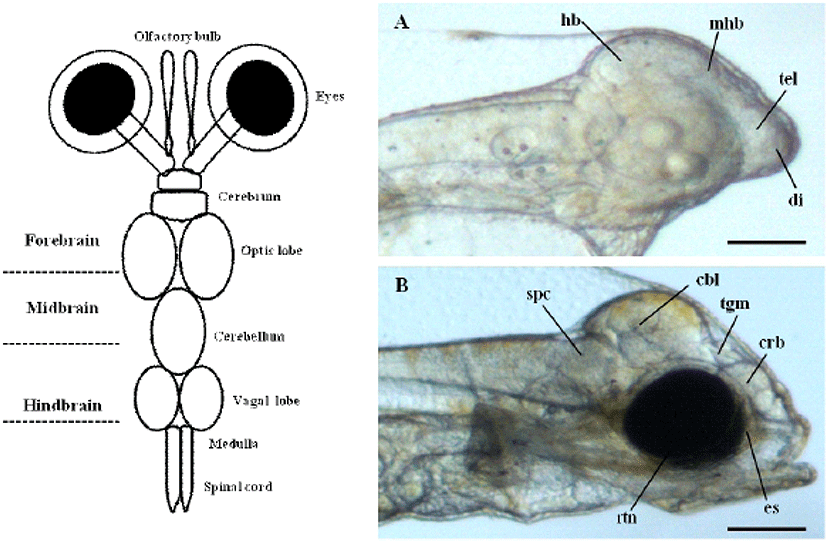
To determine the origin of the visual system during early stage of development in olive flounder, we previously observed the brain and eyes of living olive flounder larvae at 1 and 3 day after hatching (DAH) using a dissecting stereo microscope. The normal size and shape of the cerebrum, telencephalon, diencephalon, tectum, tegmentum, midbrain-hindbrain boundary, hindbrain, and brain ventricles can be observed at this stage. The first morphological changes leading to the ocular formation clearly show as early as 3 DAH in olive flounder larvae (Fig. 1A, B). It is not possible to distinguish between the prospective eyes during same period. However, the surface overlying the evaginating retinal cup can be seen to from an eye sac under a transmission microscope (Fig. 1B). The crystal lens and retina of the developing optical system can be distinguished in microscopy images. The prospective lens consists of a cluster of morphologically undifferentiated cells that fills large parts of the lumen of the retinal cup anlage at this stage.

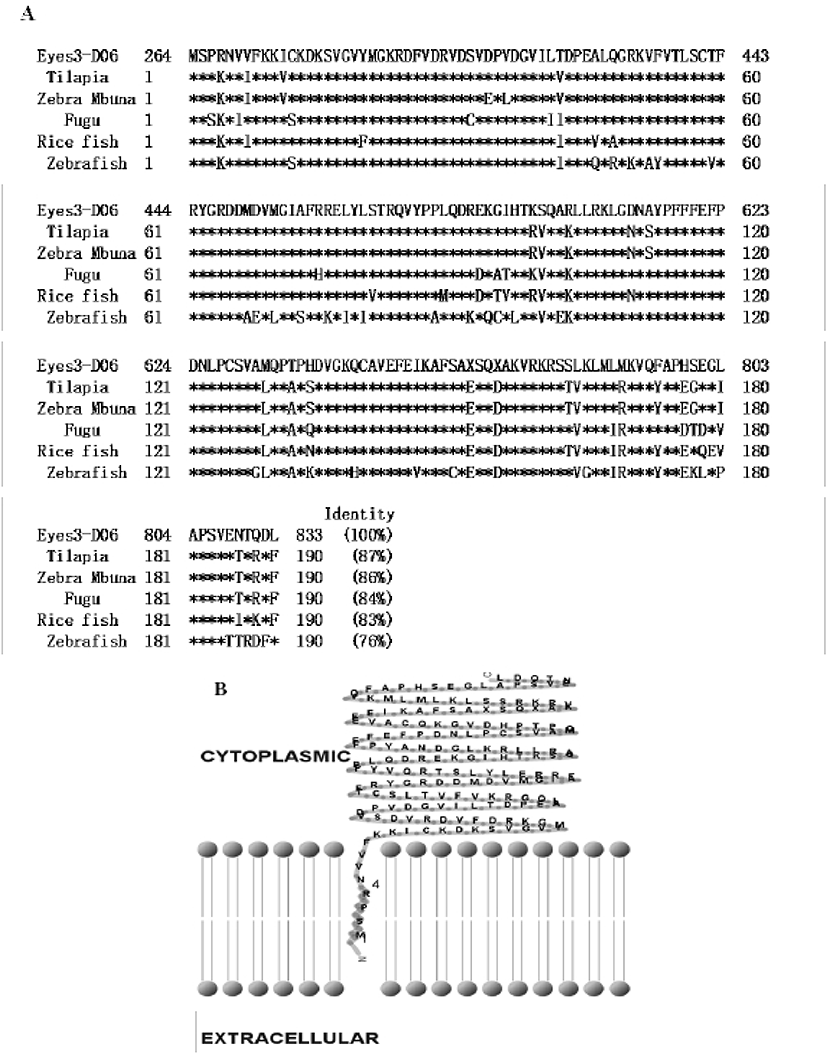
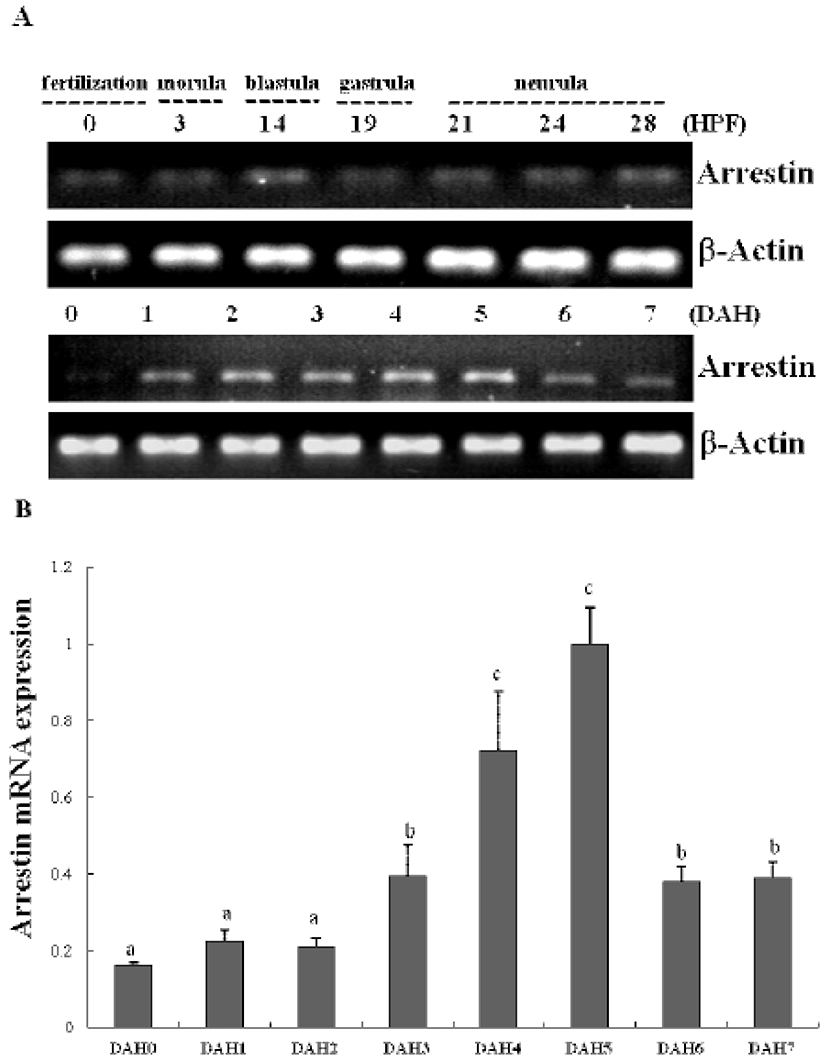
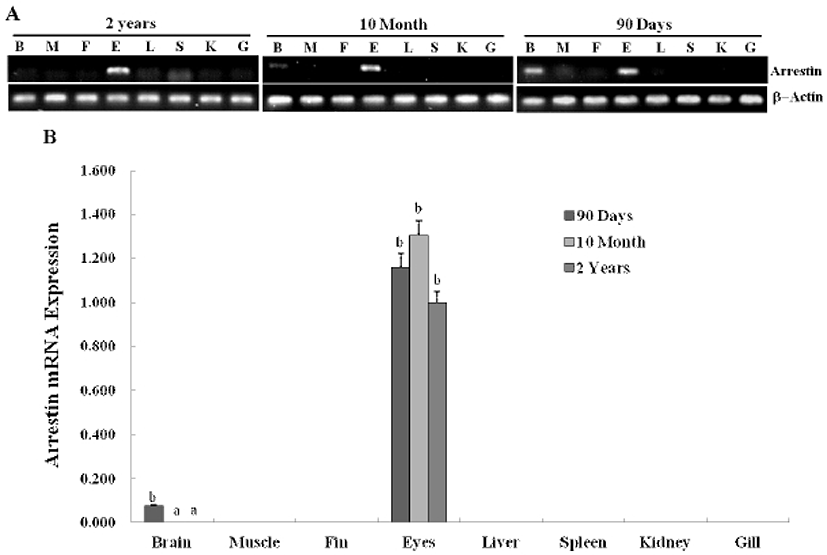
In previous study, we constructed the cDNA library using eye samples from olive flounder and screened 270 clones. Among the cDNA library, several ESTs were homologous with ocular formation-related gene and one EST had significant sequence similarity to arrestin, which is an ocular-specific gene (Lee et al., 2009; Lee et al., 2010). The homologs search of the deduced amino acid sequence of olive flounder-derived arrestin was examined using blast search of Genbank. The alignment analysis showed that amino acid sequence of olive flounder-derived arrestin homologous to arrestin of other organisms with 87–76% identity. Also, the arrestin of olive flounder was more similar to Tilapia, Zebra Mbuna, Fugu, Rice fish, and Zebrafish than other species (Fig. 2A). The localization prediction of arrestin amino acid sequences using a TMRPres2D tool shows that transmembrane domain is located in N-terminus end and placed in cytoplasmic area of membrane. This result suggests that arrestin may contribute the interaction and regulation in cytoplasmic area with other ocular development-related proteins. In the expression study of arrestin, newly identified arrestin was detected in olive flounder embryos and larvae using traditional reverse transcription-polymerase chain reaction (RT-PCR). Although expression of the arrestin gene was not detectable post-fertilization, induction of the arrestin was first detected from 1 DAH and continuously increased to 5 DAH and then gradually decreased in 6–7 DAH larvae. For further study of arrestin expression, a real time PCR assay was performed with olive flounder of various growth stage (Fig. 3A). Arrestin was similarly expressed in the eye and brain in 90-day-old flounder but not detected in other tissues. Expression of arrestin was increased the amount of transcript in the eye as the generation progresses, whereas reduced the expression in the brain. These result demonstrated that arrestin was expressed during ocular formation stage, we can be expect that arrestin will be involve in signal pathway on the ocular development process (Fig. 4).


DISCUSSIONS
In previous studies, four functional members of the arrestin gene family have been cloned (Ferguson, 2001; Freedman & Lefkowitz, 1996). Two arrestins, visual arrestin (Shinohara et al., 1987; Yamaki et al., 1987) and cone arrestin (Craft et al., 1994; Murakami et al., 1993), are exclusively expressed in the retina, where they regulate photoreceptor function. The β-arrestins, β-arrestin 1 (Lohse et al., 1990) and β-arrestin 2 (Attramadal et al., 1992), are ubiquitously expressed proteins whose highest levels of expression are seen in the brain and ocular. Although arrestin was expressed as light-dependent manner that was known for a long time, this is what functions in the formation of the visual system that has not been revealed. As previous reports, we found that arrestin is expressed in the ocular formation stages and also highly expressed in the brain tissue of 90-day-old flounder. Real-time PCR data shows that arrestin mRNA is expressed in post-hatching developmental stages, and is detectable until 5 days after hatching. An interesting feature of the eye-specific arrestin gene expression is its relatively high expression in the postnatal brain. Optical formation was observed in the early developmental stages and the arrestin gene was significantly expressed at same stage, suggesting that arrestin plays a crucial role in signal transduction in the retina during early stage of development.
All family of the arrestin can bind specifically to light-activated or agonist-occupied heptahelical G-protein-coupled receptors (GPCRs) that have been phosphorylated by G-protein-coupled receptor kinases (GRKs). The binding of arrestin sterically interferes to the receptor-G-protein interaction and thus plays a critical role in the process of homologous desensitization and normal embryological development (Bohn et al., 1999; Conner et al., 1997). Whether beta-arrestin is required for the normal development or sufficient to compensate for the lack of other arrestin isotypes is not clear. However, in a recent studies showed that a homozygous knockout of both murine β-arrestins results in early embryonic lethality, these finding suggests that arrestins are essential for normal development (Luttrell & Lefkowitz, 2002; Yue et al., 2009). Also, Roman et al. (2000) reported that a novel nonvisual arrestin of Drosophila was ubiquitously expressed during early embryonic development and afterward primarily localizes to the central nervous system (Roman et al., 2000). The increase of visual arrestin gene expression in signal transduction suggests that it has a protective role, perhaps in response to light exposure or other stimulus to the eye.
In conclusion, bioinformatics and expression analysis of visual arrestin during the stages of optical formation may assist the study of the initial larval life and growth in the olive flounder. Further functional studies on this gene will provide more information on molecular regulatory mechanisms, identity of arrestin subunit genes, and GPCR signaling pathways that are involved in ocular formation in the olive flounder.