INTRODUCTION
Hairtail (Trichiurus lepturus), ecologically warm water fish species, belonging to family Trichiuridae, widely distributed on the coast of the Yellow Sea, South Sea and Jeju island in the Korean Peninsula and the several sea areas in China under the natural ecosystem. The food consumption of this species has increased considerably in various types of restaurants (including restaurants specializing in serving hairtails roasted and soy-sauce glazed cutlass fish with radish or other vegetables) for a long time. However, in spite of their economic and scientific significances, a little information currently exist regarding the physiological (Huh, 1999; Cha & Lee, 2004) and ecological levels (Zhang & Sohn, 1997; Park et al., 2000) only of hairtail species in Korea. Only the biological fisheries feature, distribution and migration of hairtail (T. lepturus) in Korean waters were investigated (Kim et al., 1998; Park et al., 2002). Lately, imported hairtail have been changed into endemic hairtail because of high margin. Particularly, clustering analysis of the genetic distance among various fishes and/or mollusks species or populations apart from geographic sites using PCR is of little quantity (Klinbunga et al., 2000; McCormack et al., 2000; Park et al., 2005; Yoon & Kim, 2010; Song & Yoon, 2013), although genetic variation and species-specific and region-specific markers was assessed by molecular biological methods (Partis & Wells, 1996; Cagigas et al., 1999). In the present study, to elucidate the genetic distances and differences between geographical hairtail populations, the author performed a clustering analysis of two hairtail populations collected from Korea and China.
MATERIALS AND METHODS
Muscle tissues were collected separately from hairtail (Trichiurus lepturus) individuals from Korea in the Yellow Sea and China in the East Sea, respectively. PCR analysis was performed on DNA samples extracted from a total of 22 individuals using different eight oligonucleotides primers. Hairtail muscle was collected in sterile tubes, immediately placed on dry ice, and stored at –40°C until the genomic DNA extraction. The extraction/purification of genomic DNA was performed under the experimental conditions previously described (Yoon & Kim, 2004). PCR analyses were performed on the muscle extract of 22 individuals using eight primers. Eight primers, OPA-07 (5’-GAAACGGGTG-3), OPA-20 (5’-GTTGCGATCC-3’), OPB-14 (5’-TCCGCTCTGG-3’), OPB-15 (5’-GGAGGGTGTT -3’), OPB-17 (5’-AGGGAACGAG-3’), OPB-18 (5’-CCA CAGCAGT-3’), OPD-16 (5’-ACCCGGTCAC-3’) and URP-07 (20-mer) were used to generate the bandsharing values and genetic distances which could be clearly scored. PCR was performed using two Programmable DNA Thermal Cyclers (Perkin Elmer Cetus, Norwalk, CT, USA; MJ Research Inc., Waltham, MA, USA). PCR analysis was performed on the muscle extract of 22 individuals using eight primers. The concentration of the extracted genomic DNA was measured by optical density at 260 nm by a spectrophotometer (Beckman Coulter, Buckinghamshire, UK). The 100-bp DNA Ladder (Bioneer Corp., Daejeon, Korea) was used as the DNA molecular weight marker. The electrophoresed agarose gels were illuminated by ultraviolet rays, and photographed using a photoman direct copy system (PECA Products, Beloit, WI, USA). The degree of variability was calculated by use of the Dice coefficient (F), which is given by the formula: F = 2 nab/(na+nb), where nab is the number of bands shared between the samples a and b, na is the total number of bands for sample a and nb is the total number of bands for sample b (Jeffreys & Morton, 1987; Yoke-Kqueen & Radu, 2006). Euclidean genetic distances within- and between-populations were also calculated using the hierarchical dendrogram program Systat ver.10 (SPSS Inc., Chicago, IL, USA).
RESULTS AND DISCUSSION
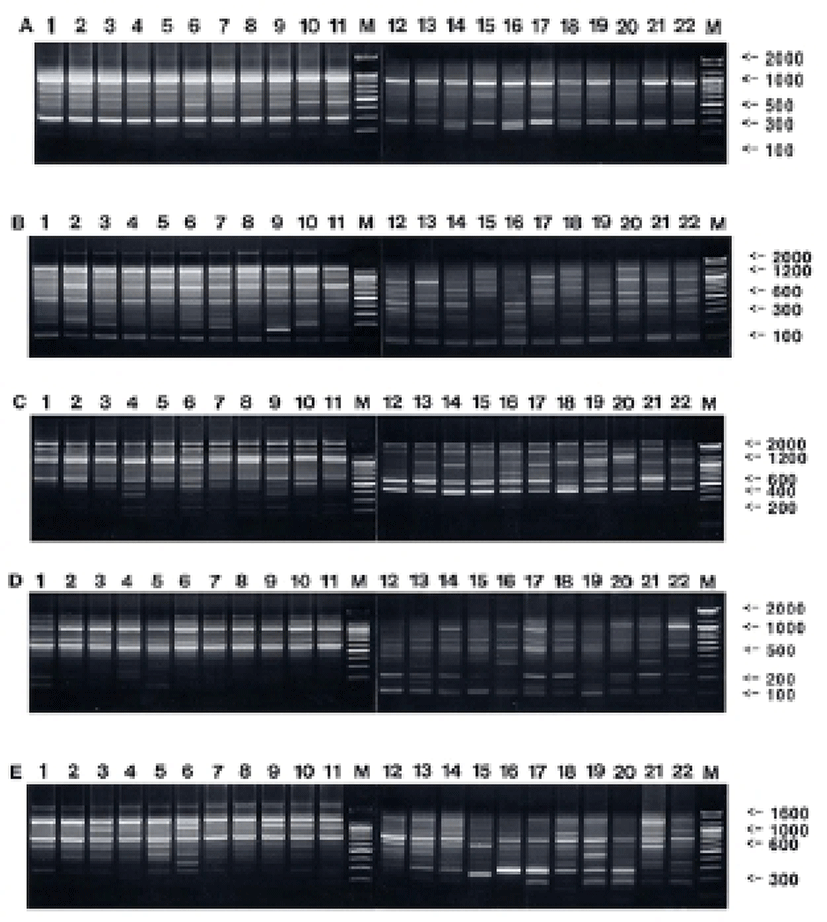
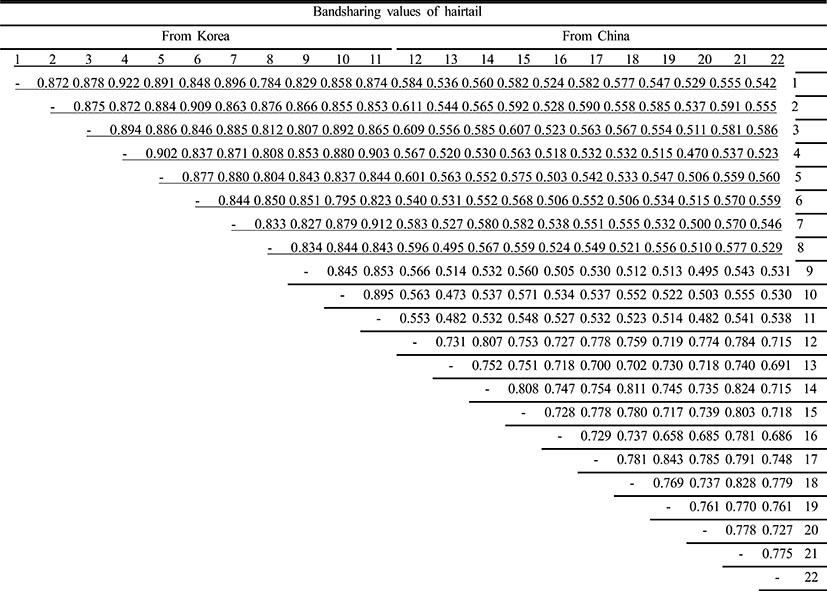
Oligonucleotides primers were used generating a total of 777 scorable fragments in hairtail population from Korea and 783 in population from China, respectively, ranging in size of DNA fragments from larger than approximately 150 to larger than 2,400 bp (Fig. 1). The complexity of the banding patterns varied dramatically between primers and/or geographically separated locales. Various researchers have studied the sizes of DNA fragments in the PCR profiles of barramundi (Lates calcarifer) (Partis & Wells, 1996), brown trout (Salmo trutta) (Cagigas et al., 1999), crucian carp (Carassius carassius) (Yoon & Park, 2002), and yellowfin tuna (Thunnus albacares) (Diaz-Jaimes & Uribe-Alcocer, 2003). Particularly, the oligonucleotides decamer primer, OPF-10 produced 11 amplified fragments, with sizes from 200 bp to 600 bp (Diaz-Jaimes & Uribe-Alcocer, 2003). Six primers were also commonly used, generating a total of 602 scorable bands in catfish, and 195 in the bullhead population, respectively, ranging in DNA fragment size from approximately 100 bp to more than 2,000 bp (Yoon & Kim, 2004). The similarity matrix based on the average bandsharing values of all of the samples within hairtail population from Korea ranged from 0.784 to 0.922, whereas 0.658~0.843 within population from China (Table 1). The average bandsharing value (mean±SD) within hairtail population from Korea showed 0.859±0.031, whereas 0.752±0.039 within population from China. Also, bandsharing values between two hairtail populations ranged from 0.473 to 0.611, with an average of 0.542±0.059. The bandsharing value between individual No. 01 and No. 04 showed the highest level (0.922) within hairtail population from Korea, whereas the value between individual No. 01 and No. 08 showed the lowest level (0.784). Also, the bandsharing value between No. 17 and No. 19 showed the highest level (0.843) within hairtail population from China, whereas the value between No. 16 and No. 19 showed the lowest level (0.658). As compared separately, the bandsharing values of individuals within hairtail population from Korea were comparatively higher than those of individuals within population from China. Additionally, the bandsharing value between individual No. 02 and No. 12 showed the highest level (0.611) between two geographic hairtail populations, whereas the value between individual No. 04 and No. 20 showed the lowest level (0.470). In the present study, the bandsharing values between two hairtail populations, with an average of 0.542±0.059, as calculated by bandsharing analysis, were different from the results of Yoon & Park (2002) stated that the average level of bandsharing obtained by the five decamer primers used was 0.400±0.050 in the wild crucian carp population, contrast with 0.690±0.080 observed in the cultured crucian carp population.


|
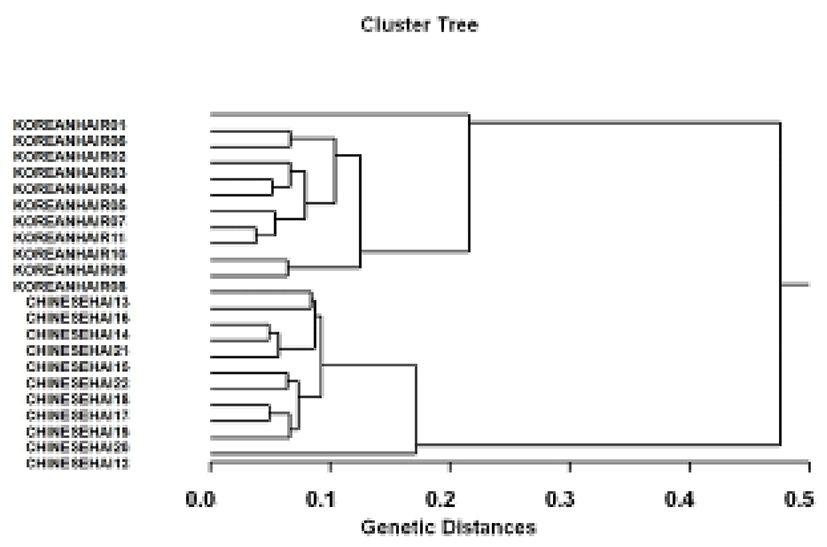
The hierarchical dendrogram resulted from reliable oligonucleotides primers, indicating two genetic clusters composed of cluster 1 (KOREANHAIR1~KOREANHAIR11) and cluster 2 (CHINESEHAI12~CHINESEHAI22). (Fig. 2) The genetic distances between two geographic populations ranged from 0.038 to 0.476. Individual No. 11 within hairtail population from Korea was genetically closely related with No. 10 (genetic distance=0.038). The longest genetic distance (0.476) displaying significant molecular difference was also between individual No. 01 within hairtail population from Korea and No. 22 from Chinese. In the present study, PCR analysis has revealed significant genetic distances between two hairtail population pairs (P<0.05). This cluster analysis revealed the patterns similar to those posited by Cagigas et al. (1999) and Yoon & Kim (2004). Via the cluster analysis of genetic similarity values obtained from genetic data, the genetic distance ranged from 0.091 to 0.316 within and among four natural Spanish populations of brown trout (Salmo trutta) (Cagigas et al., 1999). The principal aspect of the dendrogram was also a remarkable separation of sample 1 from the others, which were closely grouped. Accordingly, PCR analysis generated on the PCR data showed that the geographic hairtail population from Korea in the Yellow Sea was more or less separated from geographic hairtail population from China in the East China Sea. High levels of genetic polymorphisms and the existence of population differentiation between two hairtail populations showed PCR approach is one of the suitable tools for individuals and/or population biological DNA studies. As stated above, using several oligonucleotides primers, this PCR analysis has been applied to identify specific/polymorphic markers particular to breed, species and geographical population, as well as genetic polymorphism/diversity in numerous organisms (Partis & Wells, 1996; McCormack et al., 2000; Klinbunga et al., 2000; Diaz-Jaimes & Uribe-Alcocer, 2003).
