INTRODUCTION
Manila clam (R. philippinarum) is, environmentally warmwater bivalve species, belonging to family Veneridae, widely distributed on the coast of the Yellow Sea in the Korean Peninsula, as well as in several areas in China under the natural ecosystem. The clam is also indigenous to some parts of the sandy regions consisting of coarse sand and slime from 5 to 10m in depth. Clams are the most popular marine products in Korea because of their taste and nutritional value, and Koreans consume them in large quantities. The coarse surface of this shellfish species is light gray and clean white, and the inside is white under the natural conditions. Inner feet are short, triangular, and white-gray. Mostly, there are marked differences of the shell weight, size, color and shape in R. philippinarum in line with the environmental conditions of habitat such as feed, water temperature and water depth. Nevertheless, these kinds of Korean bivalve, which are recognized important morphologically (Kwon, 1999; Kang, 2000; Choi, 2000), environmentally (Cho, 2001; Shin, 2000), physiologically (Robert, 1993), reproductively (Lee, 1996), as well as histologically (Lee & Chung, 2008), are not genetically and/or molecular-biologically studied like other crustaceans. Basically, there are marked differences of the size, color and shape in R. philippinarum according to the ecological conditions of habitat such as nourish and hard period. There is a need to understand the genetic traits and composition of this clam population in order to evaluate precisely the patent genetic consequence. Particularly, the polymorphic and/or specific markers specific to the species, the genus or the geographical populations have been applied for the of individuals and species, hybrid parentage and for the screening of DNA markers (Partis & Wells, 1996; Muchmore et al., 1998; Tassanakajon et al., 1998; McCormack et al., 2000; Park et al., 2005; Song & Yoon, 2013). So far, specific fragments generated by this PCR method using arbitrary primers had virtuous merits for detecting DNA similarity and diversity between life creatures (McCormack et al., 2000). The polymorphisms are determined by the banding patterns of amplified products at the specific positions by primers (Tassanakajon et al., 1998; Yoon & Kim, 2004). The author accomplished clustering analyses to reveal the Euclidean genetic distances among four clam populations from Gochang, Seocheon, Taean and Anmyeon of the Korean peninsula.
MATERIALS AND METHODS
Adductor muscle tissues were collected separately from four R. philippinarum populations of Gochang (Manila clam from Gochang; MCG), Seocheon (Manila clam from Seocheon; MCS), Taean (Manila clam from Taean; MCT) and Anmyeon (Manila clam from Anmyeon; MCA) of the Korean peninsula, respectively. PCR analysis was performed on DNA samples extracted from a total of 20 individuals using six oligonucleotides primers. DNA extraction should be carried out according to the separation and extraction methods (Song &Yoon, 2013). After several washings, lysis buffer Ⅰ (155 mM NH4Cl; 10 mM KHCO3; 1 mM EDTA) was added to the samples, and the mixture tubes were gently inverted. Ice-cold 70% ethanol was added, and then the samples were centrifuged at 19,621 g for 5 minutes to extract the DNA from the lysates. The concentration of the extracted genomic DNA was measured with the absorbance ratio at 260 nm by a spectrophotometer (Beckman Coulter, Buckinghamshire, UK). The DNA pellets were then incubation-dried for more than 10 hours, maintained at –40℃ until analysis and then dissolved in the distilled water. Amplification products were separated by electrophoresis in 1.4% agarose gels with TBE, using DNA ladder (Operon Technologies, Alameda, CA, USA) as DNA molecular weight marker and detected by staining with ethidium bromide. The author used the oligonucleotides primers to certify the genetic distances of R. philippinarum individuals. Six oligonucleotides primers (Operon Technologies, Alameda, CA, USA), OPA-08 (5’- GTGACGTAGG-3’), OPA-09 (5’-GGGTAA CGCC-3’), OPA-11 (5’-CAATCGCCGT-3’), OPA-16 (5’-AGCCAG CGA A-3’), OPA-18 (5’-AGGTGACCGT-3’), and OPA-20 (5’-GTTGCGATCC-3’) were shown to generate the unique shared loci to each population and shared loci by the four R. philippinarum populations which could be clearly scored. Thus, the author used the primers to study the genetic variations and DNA polymorphisms of the Manila clam. PCR was performed using Programmable DNA Thermal Cycler (MJ Research Inc., Waltham, MA, USA) repeatedly. Six oligonucleotides primers were shown to generate the unique shared loci to each population and shared loci by the four populations which could be clearly counted. The electrophoresed agarose gels were illuminated by ultraviolet rays, and photographed using a photoman direct copy system (PECA Products, Beloit, WI, USA). Similarity matrix including bandsharing values (BS) between different individuals in the four Manila clam populations was generated according formula of Jeffreys & Morton (1987) and Yoke-Kqueen & Radu (2006). A hierarchical clustering tree was assembled using similarity matrices to yield a dendrogram, which was assisted by the Systat version 10 (SPSS Inc., Chicago, IL, USA).
RESULTS AND DISCUSSION
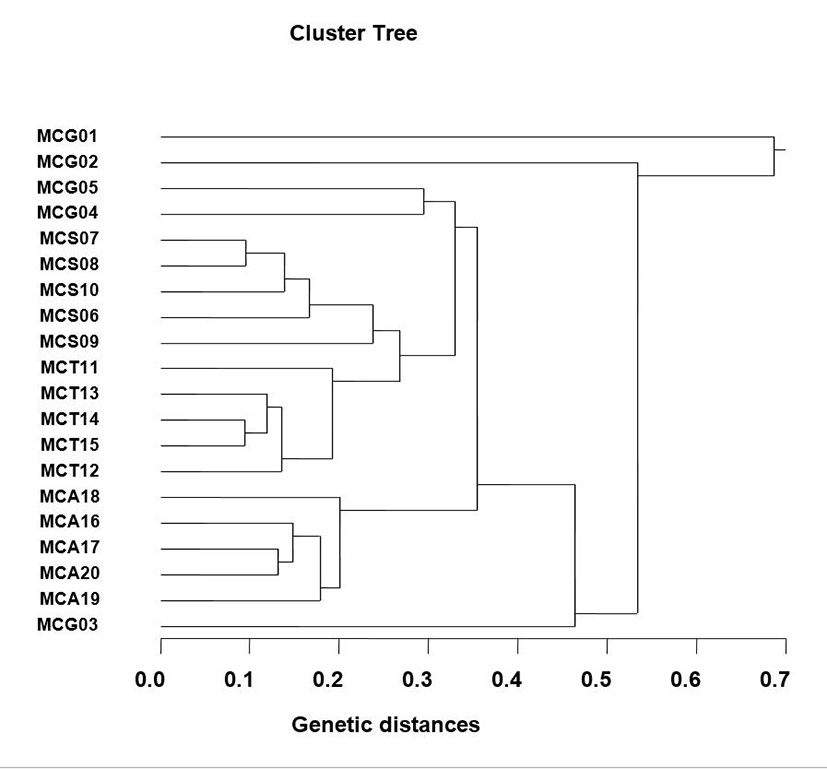
The number of unique shared loci to each Manila clam population and number of shared loci by the four clam population generated by PCR investigation using six oligonucleotides primers in the four Manila clam populations, respectively, as summarized in Table 1. The oligonucleotides primer OPA-08 generated 5 unique loci to each population, approximately 550 bp and 600 bp, respectively, in the Seocheon population. Especially, the primer OPA-20 generated 15 unique loci to each population, which were identifying each population, approximately 400 bp, 750 bp and 800 bp, in the MCT population. The primer OPA-20 generated 10 unique loci to each population, which were determining each population, approximately 400 bp and 450 bp, in the MCA population. Interestingly, every primer had not distinguished the shared loci by the four populations, major and/or minor fragments of sizes, which were identical in almost all of the samples. Several investigators researched the sizes of DNA fragments in the PCR frameworks of Eastern Pacific abalone (genus Haliotis) (Muchmore et al., 1998), black tiger shrimp (Penaeus monodon) (Tassanakajon et al., 1998), the brittle star (Amphiura filiformis) (McCormack et al., 2000), catfish (S. asotus) and bullhead (P. fulvidraco) populations (Yoon & Kim, 2004) and Pollicipes mitella population (Song & Yoon, 2013). Multiple comparisons of average bandsharing values among Manila clam populations from four sections were generated according to the bandsharing values and similarity matrix (Table 2). Ultimately, individuals from MCS clam population (0.637±0.227) exhibited higher bandsharing values than did individuals from MCG clam population (0.402±0.115) (P<0.05). As shown in Fig.1, the dendrogram obtained by the six oligonucleotides primers indicates four genetic clusters: cluster 1 (MCG 01, 02, 04 and 05), cluster 2 (MCS 06, 07, 08, 09 and 10), cluster 3 (MCT 11, 12, 13, 14 and 15) and cluster 4 (MCA 16, 17, 18, 19, 20 and MCG 03). Among the twenty clams, the shortest genetic distance that displayed significant molecular differences was between individuals 14 and 15 from the MCT population (genetic distance = 0.094), while the longest genetic distance among the twenty individuals that displayed significant molecular differences was between individuals MCG no. 01 and MCG no. 02 (genetic distance = 0.687). Relatively, individuals of Seocheon clam population were fairly closely related to that of MCT clam population, as shown in the hierarchical dendrogram of Euclidean genetic distances. The inter-population similarity indices and genetic distance values indicated that the Jamuna- Padma population pair of the Indian major carp (Catla catla) was genetically closer than the Halda-Jamuna and the Halda-Padma population pairs, which agreed with the geographical distances between them (Islam et al., 2005). They suggested that the RAPD technique could be used to discriminate between different river populations of major carp. In invertebrates, cluster analysis of the pairwise population matrix, generated from genetic data, showed that geographically close populations be inclined to cluster together in the blacklip abalone (Huang et al., 2000). As a whole, the population grouping of R. philippinarum is founded on morphological variations in shell type, shell color, shell length, shell width and feet length. The prospective of oligonucleotides amplified polymorphic DNAs to determine diagnostic markers for species, genus and population identification in crustacean has also been well recognized (Partis & Wells, 1996; Tassanakajon et al., 1998; McCormack et al., 2000; Diaz-Jaimes & Uribe-Alcocer, 2003; Park et al., 2005; Song & Yoon, 2013). PCR fragments revealed of in the present study may be valuable as a DNA marker the four regional populations to distinguish.
| Population | MCG | MCS | MCT | MCA |
|---|---|---|---|---|
| MCG | 0.402±0.115 c | 0.366±0.170 a | 0.432±0.168 c | 0.381±0.175 b |
| MCS | – | 0.637±0.227 e | 0.446±0.093 c | 0.387±0.160 b |
| MCT | – | – | 0.632±0.229 e | 0.417±0.191 c |
| MCA | – | – | – | 0.435±0.188 c |