INTRODUCTION
Uric acid (UA) is the terminal product of purine metabolism and is produced from hypoxanthine by xanthine oxidase (XO) of the liver (Wu et al., 1992). The serum UA level is determined by the extent of de novo purine synthesis, tissue catabolism, and exogenous proteins delivered to the liver (Kikuchi et al., 2017). UA excretion is controlled by kidney transporters, renal plasma flow, glomerular filtration, and proximal tubular exchange (George & Struthers, 2009; So & Thorens, 2010). An imbalance between UA production and excretion induces hyperuricemia, a major cause of gout, obesity, cardiovascular and renal diseases, hypertension, and metabolic syndrome (Edwards, 2009). Though UA exerted the modest antioxidant activity, hyperuricemia is a potentially harmful condition. It favors deposition of UA crystals in the joints and kidneys (Grassi et al., 2013). UA generates oxidative stress in kidney cells, promotes apoptosis by inducing imbalances of anti-apoptosis proteins and pro-apoptosis proteins, and causes inflammatory and endothelial dysfunction (Quan et al., 2011; Verzola et al., 2014).
Allopurinol (AP; an inhibitor of XO) is the synthetic drug most widely used to treat hyperuricemia (Pacher et al., 2006); its use is associated with certain side effects such as gastrointestinal distress, hypersensitivity reactions, rash, eosinophilia, and worsening of renal function (Pacher et al., 2006; Feig et al., 2008). Hence, searching for new agents with fewer side effects are required. Natural products (complex bioactive compounds) are valuable sources of novel potent pharmaceuticals with few side effects. Many studies have examined the use of natural products to treat hyperuricemia (Zhu et al., 2004).
Clerodendrum trichotomum Thunb of the Verbenaceae grows in fields and mountains of Korea, Japan, and China (Lee, 1973). The leaves and stems that used to treat arthritis and hypertension (Kim et al., 2009), exhibit diverse pharmacological activities (antihypertensive, sedative, analgesic, and anti-inflammatory properties; Ahn, 2003; Neeta and Tejas, 2007). Phenylethanoid and flavonoid glycosides and abietane diterpenoids have been isolated and characterized from the leaves and stems (Wang et al., 2013). However, their possible anti-hyperuricemic effects have not yet studied. Here, we explored the hypouricemic potential of C. trichotomum leaf extract (CTE) in potassium oxonate (PO)-induced mice. In addition, we investigated the transcriptome changes by CTE administration in livers of PO-induced mice using DNA microarray analysis.
MATERIALS AND METHODS
C. trichotomum leaves were collected from the northern part of Jeju Island in July 2016. The leaves were washed, dried, and pulverized to powder of 100–200 mesh. The powders were extracted for 4 h with hot water (90°C). CTE was concentrated, freeze-dried, and stored at –70°C until use.
Human renal tubular epithelial HK-2 cells and murine macrophage RAW 264.7 cells were purchased from the Korean Cell Line Bank (Seoul, Korea). Cells were cultured in Roswell Park Memorial Institute-1640 medium (RPMI-1640, Gibco, Grand Island, NY, USA) supplemented with 10% fetal bovine serum and 1% penicillin-streptomycin (Gibco) or Dulbecco’s modified Eagle’s medium (DMEM, Gibco) containing 10% fetal bovine serum and 1% penicillin-streptomycin (Gibco) at 37°C in a 5% CO2.
The cell viability was assessed using the MTT assay. HK-2 cells were seeded into 96-well plates at 2×10⁵ cell/mL and allowed to adhere overnight. After cells were pre-treatment with various concentrations of CTE for 1 h, UA (20 mg/dL) was added and cultured for 48 h. RAW 264.7 cells were pretreated with indicated concentration of CTE for 1 h, and then co-treated with UA (20 mg/dL) and LPS (100 ng/mL) for 24 h. After then, each well was supplemented with 50 μL of MTT and incubated for 4 h at 37°C. The formazan crystals formed were subsequently dissolved in 200 μL DMSO, and the optical density of the resultant reaction solution was read at 595 nm using a microplate reader (Bio-Tek, Winooski, VT, USA).
Male ICR mice (5 weeks of age, 30±2 g in body weight [BW]) were purchased from Orient Bio (Seongnam, Korea). All animals were allowed free access to water and standard mouse chow and were held under a regular 12-h light/dark cycle at 23±2°C and relative humidity of 60±5%. The animals were acclimatized to the environment for 7 days and then used in experiments. All experiments were approved by the Animal Care and Use Committee of Jeju National University (approval no. 2016-0043). The uricase inhibitor PO was used to induce hyperuricemia (Wang et al., 2015). PO (250 mg/kg) was intraperitoneally administered daily 1 h before drug administration for 7 consecutive days. The mice were randomly divided into four groups (n=6 per group). Normal control (NC) mice were fed only the basic diet. A PO-induced hyperuricemic group (PO+50 mg saline/kg BW), an AP group (PO+5 mg AP/kg of BW), and a CTE group (PO+400 mg CTE/kg BW); the AP and CTE were given on the day after PO was given.
After 6 days of drug administration, urine samples were collected for 24 h in a metabolic cage and centrifuged. The supernatants were collected, and used for UA and creatinine content assays. On the last day (day 7), all mice were anesthetized with ethyl ether. Blood samples were drawn from the heart into a syringe and allowed to stand at room temperature. Serum samples were then collected by centrifugation at 800×g for 10 min. The tissues were extracted, rapidly cooled in liquid nitrogen, and stored at −70°C. The serum and urine UA levels, blood urea nitrogen (BUN), and serum creatinine levels were measured using a UA kit (Abnova, Taipei, Taiwan), a BUN assay kit (Asan Pharm, Gyeonggi-do, Korea), and a creatinine assay kit (BioAssay Systems, Hayward, CA, USA) according to the manufacturers’ protocols.
Cells and tissues were resuspended in cold lysis buffer (1×RIPA buffer, 1 mM phenylmethylsulfonyl fluoride, 1 mM Na3VO4, 1 mM NaF, 1 μg/mL aprotinin, 1 μg/mL pepstatin, and 1 μg/mL leupeptin) and collected by centrifugation at 21,000×g for 20 min at 4°C. Lysate protein concentrations were determined using a protein assay featuring a dye reagent (Bio-Rad; Hercules, CA, USA). The proteins were subjected to electrophoresis on 10% (w/v) SDS– polyacrylamide gels and transferred to polyvinylidene fluoride membranes; the membranes were blocked with 5% (w/v) skim milk and 0.1% (v/v) Tween-20 in Tris-buffered saline for 1 h and then incubated with primary antibodies overnight at 4°C. The primary antibodies recognized the following proteins: Bax (Santa Cruz Biochemicals; Santa Cruz, CA, USA); Bcl-2 (Santa Cruz); caspase-3 (Santa Cruz); cleaved caspase-3 (Cell Signaling, Danvers, MA, USA); iNOS and TNF-α (Santa Cruz); and COX-2 (BD Biosciences; Franklin Lakes, NJ, USA). The membranes were incubated at room temperature for 1 h with a peroxidase-conjugated secondary antibody (Vector Laboratories, Burlingame, CA, USA), and proteins were detected using the Westar ETA C 2.0 substrate (Cyanagen; Bologna, Italy). For histochemical analysis, liver tissues were fixed with paraformaldehyde, washed, dehydrated and embedded in paraffin. Then, a paraffin block was prepared and sectioned with a microtome to prepare a tissue slice. The serial paraffin sections were stained with hematoxylin and eosin solution. Immunostaining for tumor necrosis factor-α (TNF-α) was performed using TNF-α antibody (Life technologies, Carlsbad, CA, USA) and biotinylated goat-anti-rabbit IgG (Vector, USA). The histological changes were observed with a microscope (BX-51, Olympus, Tokyo, Japan).
Total RNAs from liver tissues were isolated using Trizol reagent (Invitrogen, Carlsbad, CA, USA). To reduce variation among individuals within each experimental group, equal amounts of total RNA from individual within the same group were pooled together. RNA quality was assessed using the Agilent 2100 bioanalyzer and the RNA 6000 Nano Chip (Agilent Technologies, Amstelveen, The Netherlands), and RNA was quantified using the ND-2000 Spectrophotometer (Thermo Fisher Scientific, Waltham, MA, USA). DNA microarray was performed using Agilent Mouse GE 4 X 44K (V2). Briefly, amplification, labeling, hybridization, and wash were performed with Agilent’s Low RNA Input Linear Amplification kit PLUS and Gene Expression Hybridization Kit, according to the manufacturer’s instructions. The hybridization images were scanned by DNA microarray Scanner and the data analysis was performed using Agilent Feature Extraction software 10.7 and GeneSpringGX 7.3.1 (Agilent Technologies, Amstelveen, The Netherlands). Gene classification was based on searches of DAVID (http://david.abcc.ncifcrf.gov/) and Medline databases (http://www.ncbi.nlm.nih.gov/).
RESULTS
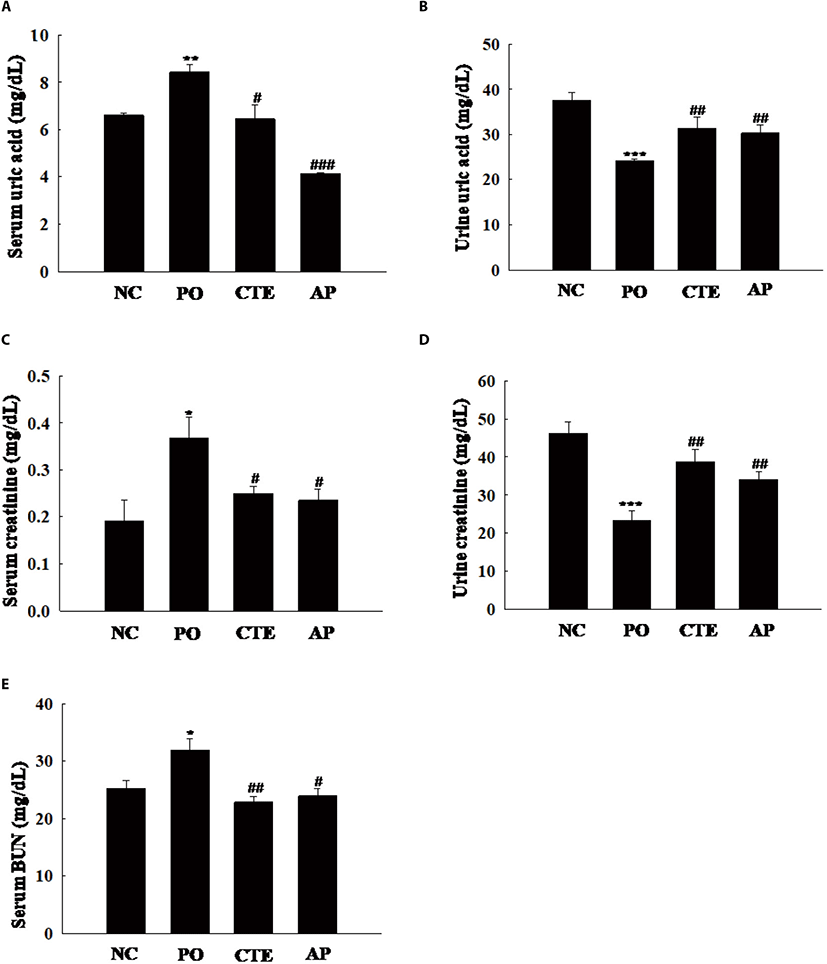
The hypouricemic potential of CTE was assessed by measuring serum and urine UA levels. These UA levels were significantly increased in the PO group compared to the NC group (Fig. 1A), indicating that hyperuricemia was indeed induced by PO. The serum UA level in the CTE group was higher than that in the AP group (positive control), but lower than that in the PO group. However, the urine UA levels were higher in the CTE and AP groups than in the PO group (Fig. 1B). To evaluate whether CTE affected kidney function in mice with PO-induced mice, we measured the levels of creatinine and BUN in serum and urine. The serum creatinine level was significantly higher in the PO than in the CTE group (Fig. 1C). However, the urine creatinine level was significantly higher in the CTE than in the PO group (Fig. 1D). The serum BUN level in the CTE group was significantly lower than that in the PO group, being similar to those in the NC and AP groups (Fig. 1E).

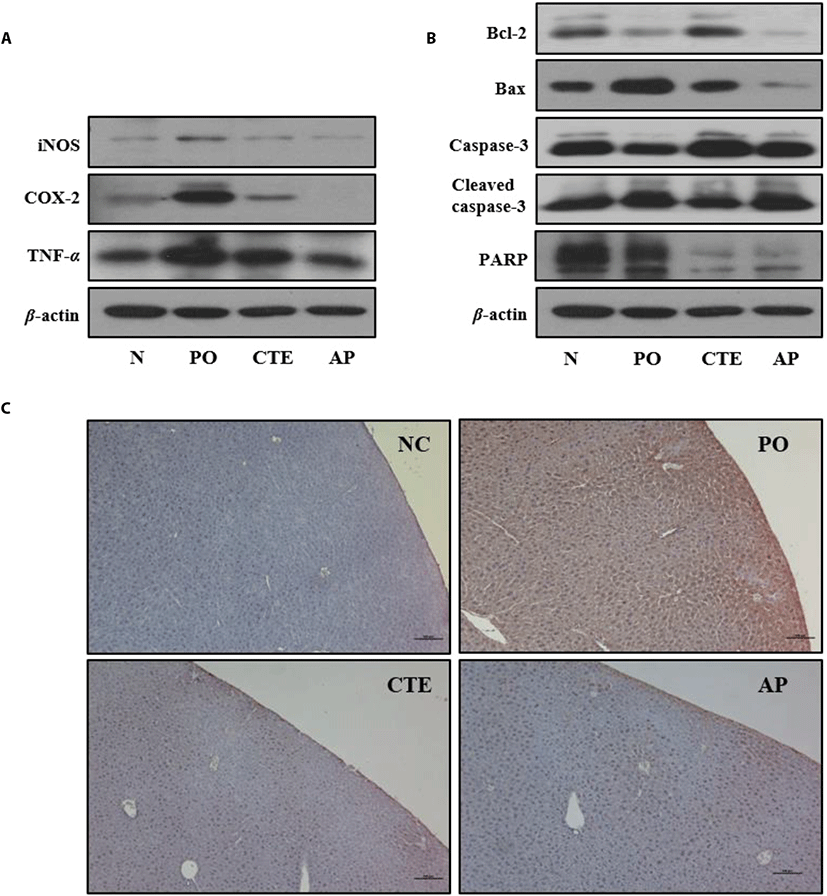
To explore whether CTE improve kidney function of PO-induced mice, the effects of CTE on the levels of inflammation= and apoptosis-related protein expressions were investigated via Western blotting. The levels of the inflammation-related proteins iNOS, COX-2, and TNF-α in kidney tissues were significantly higher in PO group than those of the NC group. However, the levels in the CTE group were lower than those in the PO group (Fig. 2A). Similarly, the levels of apoptosis-related proteins were affected by CTE treatment (Fig. 2B). The anti-apoptotic protein Bcl-2 was upregulated, and the pro-apoptotic protein Bax downregulated in both CTE and AP groups compared to the PO group. CTE increased the procaspase-3 level and decreased that of cleaved caspase-3. Also, the immunohistochemical staining against TNF-α in liver tissues of PO-induced mice group showed clearly that the expression of TNF-α was higher in PO group compared to CTE and AP groups (Fig. 2C).

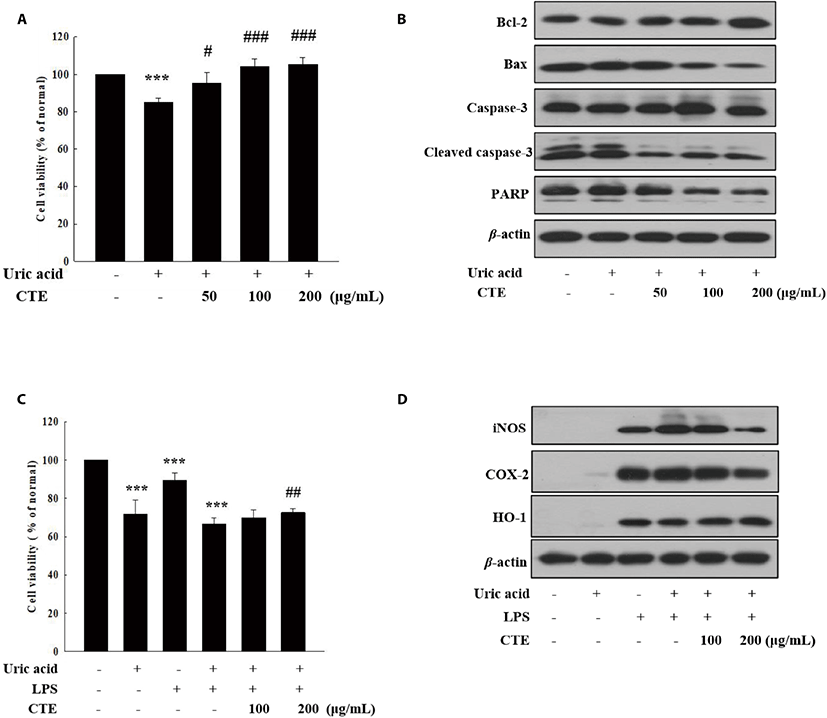
The effects of CTE on cell viability and expressions of cytoprotective protein in UA-induced cells were analyzed by MTT assay and Western blotting. As shown in Fig. 3A, CTE ameliorated dose-dependently the UA-induced cytotoxicity in HK-2 cells. Consistent with this result, CTE treatment decreased the expressions of proapoptotic protein Bax, and PARP and cleaved caspase-3, while it increased the expression of antiapoptotic protein Bcl-2 in UA-induced HK-2 cells (Fig. 3B). Additionally, the anti-inflammatory activity of CTE was investigated in UA-induced RAW 264.7 cells. CTE treatment (200 μg/mL) decreased significantly UA-induced cytotoxicity in LPS-stimulated RAW 264.7 cells (Fig. 3C). LPS stimulated NO production in UA-induced RAW 264.7, but NO production was significantly reduced by CTE treatment (data not shown). Consistent with this result, CTE decreased the expression of pro-inflammatory proteins (iNOS and COX-2) and increased the expression of antioxidant protein, heme oxygenase-1 (HO-1) in UA-induced RAW 264.7 with LPS (Fig. 3D).

To explore how CTE affects the global gene expressions in PO-induced mice, we analyzed the gene expression profiles of liver tissues via DNA microarray. Among 39,429 genes detected in microarray, we identified total 869 differentially expressed genes (DEGs) by comparing the transcriptome profiles in CTE versus PO groups (using 2.0-fold as the cut-off value). To understand the signatures of these DEGs, we performed Gene ontology (GO) and Kyoto Encyclopedia of Genes and Genomes (KEGG) pathway analysis. GO analysis revealed that CTE administration enriched significantly various GO biological processes, such as the extrinsic apoptotic signaling pathway in absence of ligand, positive regulation of MAPK cascade, negative regulation of endothelial cell apoptotic process, cholesterol metabolic process, apoptotic process, and cellular response to insulin stimulus (p<0.05, Table 1). The pathway analysis showed that CTE administration enriched highly the pathways, such as Ras signaling, Rap1 signaling, glycerolipid metabolism, PPAR signaling, and VEGF signaling pathway (p<0.05, Table 2).
The top 37 enriched GO term (biological processes) associated with the found DEGs. Count: number of annotated gens in the data CTE, Clerodendrum trichotomum leaf extract; PO, potassium oxonate.
The top 8 significant pathways associated with the identified DEGs. Count: number of annotated genes in the data set. KEGG, kyoto encyclopedia of genes and genomes; CTE, Clerodendrum trichotomum leaf extract; PO, potassium oxonate.
DISCUSSION
In recent years, morbidity due to hyperuricemia has rapidly increased in both young and elderly generations. Current hypuricemic agents, such as AP and benzbromarone, used for lowering serum UA are sometimes limited due to the associated unacceptable adverse events including fever, development of rashes, Steven–Johnson’s syndrome, and AP hypersensitivity syndrome (Pacher et al., 2006; Feig et al., 2008). Therefore, there is a growing demand for edible hypouricemic ingredient that can complement the side effect of current therapeutic drugs. C. trichotomum is considered as a traditional anti-gout herbaceous plant due to its bioactivities, such as anti-hypertension and anti-inflammatory agent (Lee, 1973). The aim of this study was to investigate the hypouricemic potential of CTE in PO-induced mice.
It was well known that PO elevated the XO activity and UA level in mouse liver, and impaired renal function. CTE and AP administration significantly decreased the serum UA level, but increased urine UA level in PO-induced mice, although effect of CTE did not reached that of AP (positive control). Since it was reported that CTE had potent XO inhibitory activity (Kim et al., 2017), CTE presumably can reduce the production of UA in the liver. To evaluate the effect of CTE on kidney function in PO-induced mice, we measured the serum and urine creatinine and BUN levels. CTE administration decreased the serum creatinine level, but increased the urine creatinine level in PO-induced mice. The glomerular filtration rate is considered as an indicator of kidney function (Fan et al., 2014). Thus, it is suggested that CTE improve kidney function by controlling the BUN and creatinine levels. Together, these results suggest that CTE exert the hypouricemic activities by reducing UA production and increasing UA excretion in PO-induced mice.
CTE administration decreased the expression of pro-inflammatory mediators (iNOS, COX-2, and TNF-α) and pro-apoptotic protein (Bax), and increased anti-apoptotic protein (Bcl-2) in the kidney of PO-induced mice. Especially, the expression of pro-inflammatory cytokine, TNF-α was decreased by CTE administration in liver tissues of PO-induced mice. TNF-α is not expressed under normal conditions and increased in plasma or tissue when inflammation or infection occurs and plays an important role in immune, inflammation, differentiation, and apoptosis processes (Bradley, 2008; Shin et al., 2017). Especially, TNF-α induces an inflammatory response through the NF-κB pathway and the MAPK pathway, activates caspase-8, and induces apoptosis responses (Mohamed et al., 2002; Karin & Gallagher 2009). Together, these results suggest that CTE prevent the tissue damages in PO-induced mice via anti-inflammatory and cytoprotective activities.
In this study, we confirmed the effects of CTE in vitro. We analyzed the effects of CTE on cell viability and expressions of cytoprotective and inflammatory protein in UA-induced HK-2 and RAW 264.7 cells. CTE significantly reduced UA-induced cytotoxicity in HK-2 cells. Consistent with this result, CTE treatment decreased the expressions of proapoptotic protein Bax, and PARP and cleaved caspase-3, while it increased the expression of antiapoptotic protein Bcl-2 in UA-induced HK-2 cells, indicating its cytoprotective activity in HK-2 cells. Bcl-2 family, Bcl-2, Bcl-XL, etc. inhibit apoptosis, and Bax, Bad, and Bim play a role in promoting apoptosis. When oxidative stress caused by external harmful factors causes the balance of the Bcl-2 family to decrease and Bax expression increases, apoptosis occurs due to caspase chain reaction (Li et al., 2016). Similarly, CTE treatment decreased the expression of pro-inflammatory proteins (iNOS and COX-2), and increased the expression of antioxidant heme oxygenase 1 (HO-1) protein in UA-induced RAW 264.7, indicting its anti-inflammatory activity. HO-1 breaks down the heme to make carbon monoxide (CO), iron, and biliverdin, and biliverdin is converted to bilirubin by NAD(P)H biliverdin reductase (Ryter et al., 2002). And these converted compound inhibit iNOS and COX-2 expression and NO production, and are known to have antiapoptotic properties, antioxidant and anti-inflammatory properties in various tissues and cells (Choi et al., 2012).
To explore the molecular mechanism on the hypouricemic action of CTE, we identified 869 DEGs in the liver of CTE versus PO groups using DNA microarray analysis. GO analysis showed that CTE administration regulated the expression of genes, which were involved in various biological process, such as extrinsic apoptotic signaling pathway in absence of ligand, positive regulation of MAPK cascade, cholesterol metabolic process, apoptotic process, and cellular response to insulin stimulus. KEGG pathway analysis revealed that these genes were involved in Ras signaling, Rap1 signaling, glycerolipid metabolism, PPAR signaling and VEGF signaling pathway. Taken together, these results suggest that CTE exert hypouricemic effect in part by regulating the genes, which are involved in cell signal transmitting and cytoprotective processes, thereby reducing both inflammation and apoptosis in PO-induced mice. A limitation of this study is that transcriptome analyses were performed on pooled samples from only five mice in CTE and PO (negative control) groups. However, the transcriptome data and the identified genes will serve as valuable references for further research to elucidate the molecular mechanisms of hypouricemic effect of CTE in PO-induced mice.
In summary, CTE administration exhibited the hypouricemic effect in PO-induced mice. CTE ameliorated PO-induced inflammation and apoptosis by reducing the levels of relevant proteins in kidney tissues. Also, CTE ameliorated both UA-induced inflammatory response in RAW 263.7 cells and UA-induced cytotoxicity in HK-2 cells. In addition, CTE enriched mainly the genes for mediating positive regulation of MAPK cascade and apoptotic signaling pathways. These findings suggested that CTE might be promising dietary ingredients against hyperuricemia with inflammation.
