
INTRODUCTION
Far Eastern catfish (Silurus asotus), although predominantly found in Japan, China, and Northeast Asia, are widely distributed globally (Park & Im 2001). They are important commercial freshwater fish in Korea (Kim et al., 1988; Park, 2019), and since they are more palatable than channel catfish, domestic consumption continues to increase (Lim et al., 2012). The farming production of Far Eastern catfish in Korea grossed 4269 tons in 2019, thereby making it the second largest domestically produced fish species. (Kim et al., 1988; National Statistical Office of Korea, 2020). In Korea, the catfish releasing business has remained steady since 1997, with an aim to restore fishery resources and ecosystems and to increase local resident income. However, neither the effect of the release program nor the analysis of the genetic diversity of wild catfish has been investigated. Additionally, domestic Far Eastern catfish farms produce their own seeds with limited broodstock. Continuous inbreeding has been reported to reduce growth and adaptability to environmental changes (Allendorf & Phelps, 1980; Liu et al., 2005). However, the genetic diversity of cultured Far Eastern catfish in domestic farms has not been reported, and the study of the diversity of domestic catfish is necessary to determine the changes, if any, occurring in the population.
Microsatellite markers have been suggested as useful molecular markers for analysis of populations and genetic diversity (An et al., 2012; Kim et al., 2014). Among the DNA markers used to examine diversity at the molecular level, microsatellite DNA markers, which comprise tandem DNA repeats of two to six base pairs, are the most abundant polymorphisms (Weber & May, 1989; Kohlmann et al., 2003; Liu & Cordes, 2004; Alam & Islam, 2005). These markers are extremely useful in the analysis of genetic characteristics of populations and individuals, and in the management of broodstock populations (Sekino et al., 2004).
It is essential to investigate the genetic diversity of wild domestic Far Eastern catfish to restore fishery resources and to increase local income. Additionally, the genetic diversity of cultured catfish in fish farms must be determined for continued farming. However, genetic diversity studies have not been conducted on wild and cultured catfish in Korea thus far. In this study, five microsatellite markers were used to analyze the genetic diversity and association of wild and cultured catfish in Korea.
MATERIALS AND METHODS
A total of 203 catfish were collected, which included 65 Jeonnam wild catfish (WJN), 59 Jeonbuk wild catfish (WJB), 34 Gyeongnam wild catfish (WKN), and 45 Jeonbuk cultured catfish (Cultured) (Table 1). The fin samples (203 samples) were separated, preserved in 99.9% ethanol, and transferred to the laboratory for DNA extraction. Each sample was mixed with 5% Chelex 100 (Bio-Rad Laboratories, Hercules, CA, USA ) and 1% proteinase K (Roche, Basel, Switzerland) in sterile water, incubated at 55°C for 1 h, and then at 100°C for 10 min. The mixture was centrifuged, and the supernatant was retained. Five suitable markers were selected to distinguish the diversity in catfish. For PCR, we used primer pairs designed to amplify markers SA08, SA10, SA18, SA23, and SA42, and subjected the forward primers to fluorescent dye labeling (Table 2) (Xie et al., 2015). PCR was performed using a reaction volume of 10 μL containing 100–150 ng of genomic DNA, 0.5 mM forward and reverse primers, 0.2 mM of dNTP (BioFact, Seoul, Korea) (Kim, 2018), 1.25 U of F-star Taq DNA polymerase (BioFact), 1x F-star Taq Reaction buffer (BioFact), and 1 μL dimethyl sulfoxide (Sigma, St Louis, Mo, USA) (Kim, 2018). Thermal cycling was conducted with an Applied Biosystems thermal cycler (#9902) using the following conditions: PCR was performed with 2 min denaturation at 95°C, followed by 30 cycles of 30 s at 95°C, 30 s at the appropriate annealing temperature, and 30 s at 72°C, and a final extension step at 72°C for 10 min. The generated products were confirmed by 1% agarose gel electrophoresis (Kim, 2018).
| Wild & culture | Location | Code | No. of sample |
|---|---|---|---|
| Wild | Jeonnam | WJN | 65 |
| Wild | Jeonbuk | WJB | 59 |
| Wild | Kyungnam | WKN | 34 |
| Culture | Jeonbuk | Cultured | 45 |
For fragment analysis, 1 μL of each PCR product was combined with formamide and a 500-LIZ size standard (GeneScan™ 500 LIZ; Applied Biosystems, Waltham, MA, USA), and the mixture was subjected to capillary electrophoresis using the ABI 3130 DNA Sequencer (Applied Biosystems). The GeneMapper version 4.0 fragment analysis software (Applied Biosystems) was used to determine the alleles, score, using binning in combination with manual checking, and to reveal allelic data.
The CERVUS 3.0 program (Kalinowski et al., 2007) was used to estimate the number of alleles, frequencies, expected heterozygosities, and observed heterozygosities. To test sample bias, allelic richness (AR), based on the minimum sample size was estimated using FSTAT (Goudet, 1995). The Bonferroni correction for multiple comparisons was applied to all P values obtained from multiple pairwise comparisons of FST. The Genepop 4.0 software was used to calculate inbreeding coefficient values (FIS) for all loci across all populations (Raymond & Rousset, 1995; Rousset, 2008). The genetic distance (DCE) matrix was computed with the Arlequin software to establish the genetic distances (GDs) among samples. GDs were estimated for all population pairs based on the chord distance (Cavalli-Sforza & Edwards, 1967). A phylogenetic tree was constructed using the unweighted pair group with the arithmetic mean (UPGMA) method, using the MEGA 5.05 software program, and bootstrap values were calculated using 1,000 replicates (Tamura et al., 2011).
RESULTS AND DISCUSSION
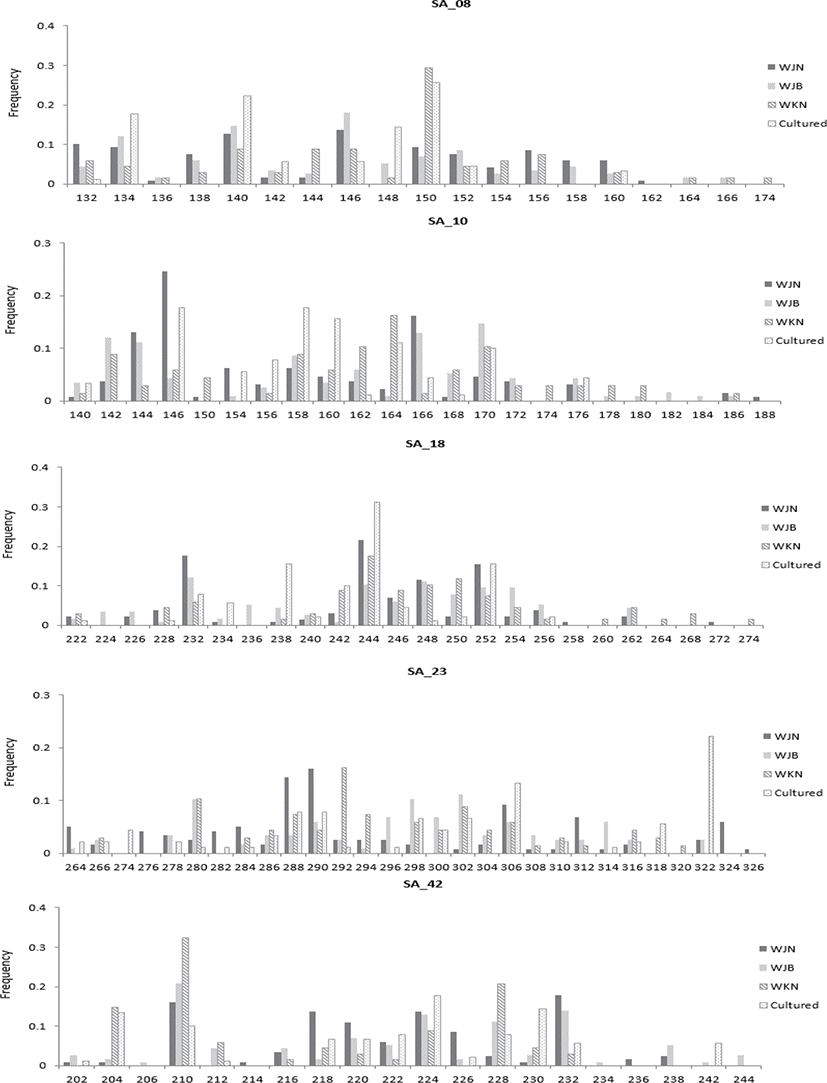
Since the genetic diversity of fish is related to environmental adaptability in aquaculture, this study evaluated the diversity of wild and farmed catfish in Korea. The genetic diversity in the three wild groups and one cultured group of S. asotus (total N=203) was assessed using the five polymorphic microsatellite loci presented earlier (Xie et al., 2015). The measure of genetic diversity for each population, calculated from the observed allele distribution is shown in Fig. 1, and each population demonstrated presence of a few unique alleles (Fig. 1). The genetic diversity of each population is presented in Table 3. Of all of the microsatellite loci, SA42 (25) showed the highest number of alleles, whereas the lowest number was detected in SA08 (9) (Table 3). Within the wild group, the highest mean value (19.0) was observed in the WJB sample, and the lowest value (16.8) was observed in the WKN sample. Overall, the average of the cultured group (13.6) was lower than that of the wild group (18.0). The allelic richness ranged from 8.738 to 21.560, and the WJN and cultured groups exhibited the highest and lowest values, respectively.
WJN, Jeonnam wild catfish; WJB, Jeonbuk wild catfish; WKN, Gyeongnam wild catfish; Cultured, cultured from Korea; NA, number of alleles; AR, allelic richness; HO, observed heterozygosity; He, expected heterozygosity; FIS, inbreeding coefficient.
Genetic diversity is important in both wild and cultured populations, and in this study, diversity assessment was performed for both groups. The highest average number of alleles in the wild group by region was observed in the WJB sample, and the lowest number was observed in the WKN sample (Kim, 2016). However, the average of the cultured group was lower than that of the wild group. Allele richness showed similar results. Using the same marker, another study determined that wild catfish in China reported an average of 23.0 alleles (Xie et al., 2015). The Korean wild group investigated in the present study showed a relatively less number than that observed with the wild catfish in China. The wild group in Korea was not as diverse as the Chinese wild samples, but the diversity was comparable to the general wild common carp family (NA, 16–26) (Biba et al., 2015; Ghelichpour et al., 2013). According to a previous study, mortality was reported to occur frequently in groups with NA values ranging from 5 to 9 in the cultured group (Mondol et al., 2006). The diversity of domestic farm groups in our study did not show a value that would exhibit fatality of the species, but it continued to decrease; hence, caution should be exercised to maintain this diversity.
Observed heterozygosity (HO) and expected heterozygosity (He) were analyzed to investigate the diversity of genotypes and alleles in the population. The average HO value for each microsatellite locus was 0.808, with the lowest value at 0.511 (SA08), and the highest value at 0.966 (SA10).
The group with the lowest average HO value for each wild-cultured group was WKN (0.776), and the highest HO value was observed in WJB (0.835). Comparison of the HO values of the wild and cultured groups revealed that the cultured group value (0.813) was lower than that of the wild WJB (0.835) and was higher than that of both the wild WJN (0.808) and WKN (0.776). The average He level was 0.899; the lowest He locus for each microsatellite locus was 0.826 at SA42, and the highest was 0.943 at SA23. Among the mean He values for each wild group, the lowest wild group was WJN (0.899), and the highest He value was WJB (0.835). Upon comparing the average He values of the wild and cultured groups, it was observed that the cultured group value (0.875) was lower than that of all wild groups (0.907). The average values of HO and He of wild catfish of the same marker were reported as 0.862 and 0.946, respectively (Xie et al., 2015). Overall, the HO and He values are considered high in both the wild and cultured groups; however, the number of members of the cultured group continues to decline more rapidly compared to the wild group. This indicates the decreasing genetic diversity in cultured groups. Decreased genetic diversity in cultured groups has been reported to be a factor which reduces adaptability to diseases along with the growth rate (Kincaid 1983; Beardmore et al., 1997). The reduction in genetic diversity has been reported to occur with less broodstock participation (Carvalho & Hauser, 1994). Broodstock with unique alleles failed to participate in seed production. As a result, unique alleles are lost and diversity is reduced, as illustrated in Fig. 1.
The Wrights inbreeding coefficient (FIS) was −0.105 to 0.389. Particularly, the cultured group demonstrated the significantly highest value at 0.389 (SA08), and the WJN group exhibited the lowest value at 0.039 (SA18). The FIS value of the wild group was as low as 0.039 with respect to the SA18 marker, and inbreeding was relatively low compared to the general wild species (0.0898) (Kim et al., 2015). The FIS was as high as 0.389 in the cultured group, and this has been shown to exert an effect on the reduction of diversity (Kim et al., 2015).
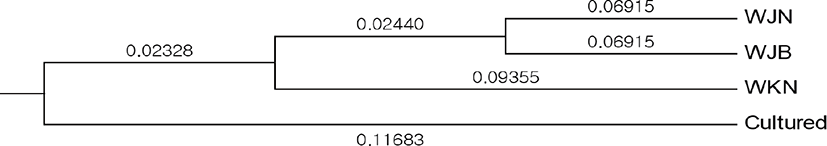
Genetic variation between the wild and cultured groups was estimated by calculating pairwise FST values. The WJN and WJB groups showed the least genetic difference with an FST of 0.015, and the WJB and cultured groups showed the greatest genetic difference at 0.034 (Table 4). Based on results of GD analysis, the WJN and WJB groups showed the closest GD at 0.138, and the cultured and WKN groups showed the farthest GD at 0.242. The phylogenetic tree was determined between the groups using the UPGMA method with GD values, and WJN and WJB were found to be located close to each other; in contrast, the cultured group was distinct and separated from others.
| Variable | WJN | WJB | WKN | Cultured |
|---|---|---|---|---|
| WJN | - | 0.1383 | 0.2173 | 0.2324 |
| WJB | 0.0152* | - | 0.1569 | 0.2266 |
| WKN | 0.0326* | 0.0163* | - | 0.2420 |
| Cultured | 0.0328* | 0.0342* | 0.0318* | - |
WJN, Jeonnam wild catfish; WJB, Jeonbuk wild catfish; WKN, Gyeongnam wild catfish; Cultured, cultured from Korea.
Pairwise FST analysis and GD analysis were performed to confirm the relationship between the groups. The results showed that the WJN and WJB groups had the lowest FST values and significantly less differentiation. In contrast, the cultured and wild groups showed the most considerable differences (p<0.05). Similar results were observed in the GD analysis; the WJN and WJB groups showed the closest GD, and the cultured and WKN groups showed the farthest GD. The results of the phylogenetic tree between groups obtained by using the UPGMA method were similar (Fig. 2). Research institutes in Jeonnam, Jeonbuk, and Gyeongnam continue to conduct catfish studies to boost catfish fry release businesses. It has been hypothesized that the genetic similarity is related to the influence of artificially joined broodstock. In contrast, the cultured group continued its own production without the introduction of new wild broodstock, and therefore they are considered to be genetically distant from the wild group. Similar results have been reported with cultured carp (Ma et al., 2006; Mondol, 2006).
In conclusion, this study was conducted to analyze the diversity of wild and cultured catfish in Korea and the relationship between groups, using microsatellite markers. It was confirmed that the genetic diversity of wild and cultured catfish was well maintained; the wild and cultured groups were genetically distant. In the case of the wild group, diversity is maintained due to the continuous fry release by the local fish research institute. The variety of cultured catfish declined, and the genetic relationship of this group was distant from that of the wild group. It was found that the reduced diversity was caused by continued self-production without the addition of new wild broodstock. This can lead to a greater genetic diversity decline in cultured catfish over the next generation; continuous genetic diversity monitoring is necessary to maintain aquaculture productivity and to develop a sustainable aquaculture industry. To determine the actual effects of the release of wild catfish, paternity analyses are warranted, using microsatellite markers with fins of parent fish that participated in the production of seeds. This study can be used as a basis for aquaculture program development and breeding research.