
INTRODUCTION
Takifugu obscurus is a migratory fish belonging to the family Tetraodontidae and order Tetraodontiformes, widely distributed on the coast of the Yellow Sea, the southern sea in the Korean peninsula, and some parts of the South China Sea. In the natural environment, the benthic river pufferfish inhabit the bottom zones, laying eggs under pebbles. They carry yellow stripes laterally with a dark-brown dorsal body and white abdomen. These pufferfish are rounded- and club-bodied with black spots detected on the pectoral and dorsal fins. Adult river pufferfish eat small crustaceans, small fish, fish eggs, and other food. They represent some of the finfish species, which are socioeconomically significant in many seashore regions.
However, despite their significant importance to fish conservation and systematic analysis, the reproductive, biochemical, and environmental aspects of river pufferfish species in Korea are unknown. Nevertheless, the pufferfish are distinct sitologically (Kang et al., 2007), nutritionally (Yoo & Bai, 2014; Yoo et al., 2014), ultrastructurally (Kim et al., 2003), reproductively (Chang et al., 1999; Kang et al., 2008), as well as environmentally (Lee et al., 2004a; Lee et al., 2004b). However, few genetic or molecular studies have comparatively analyzed finfish with other invertebrates. It is essential to elucidate the genetic traits and composition of the pufferfish population in order to appreciate its genetic value.
Comprehensive genetic markers specific to breeds, species, genera, and/or geographical populations have been used to identify and distinguish individuals, populations, and hybrid pedigrees based on molecular genetic analysis (Callejas & Ochando, 1998; Mamuris et al., 1999; Adams, 2000; Bartish et al., 2000; Kim et al., 2000; Klinbunga et al., 2000b; McCormack et al., 2000; Nebauer et al., 2000; Nozaki et al., 2000; Chenyambuga et al., 2004; Kim et al., 2006; Yoon & Kim, 2010; Hur et al., 2012; Kim & Yoon, 2018). Polymerase chain reaction (PCR) techniques have been used in mariculture and aquaculture to determine the genetic distances (GDs) between teleost species and/or invertebrates as well as geographic distribution (Tassanakajon et al., 1998; Huang et al., 2000; Klinbunga et al., 2000a; Zhou et al., 2000; Yoon & Park, 2002; Kim et al., 2004; Park et al., 2005; Song & Yoon, 2013; Oh & Yoon, 2014; Yoon, 2019).
River pufferfish farming is an aquaculture dream. In an effort to upgrade river pufferfish aquaculture, this study elucidates the GDs and variations between natural and cultured river pufferfish populations. A cluster analysis of two river pufferfish populations (natural and cultured) was also performed.
MATERIALS AND METHODS
Individual tissue samples were collected from natural and cultured river pufferfish populations. Dorsal muscle samples were obtained from the trunk of 22 individuals anesthetized with MS 222 (100 ppm) and transferred into disinfected vials. The muscles were extracted into sterile tubes carried on ice, and stored at −40°C until used. DNA extraction was performed according to the separation and removal methods described previously (Oh & Yoon, 2014). Chloroform (500 μL) was added to the mixture and then inverted (without phenol). After a few washes, the dorsal muscle tissue samples were transferred into 10 mL test tubes filled with 30 mL of lysis buffer. The tubes were lightly inverted. The tissue precipitates were detached with lysis buffer. Proteinase K solution (20 μL, 15 mg/mL) was added to the dorsal samples and incubated, followed by careful addition of 300 μL of 6 M NaCl. The DNA pellets were dried under incubation for 3 h, stored at −90°C until analysis, and thawed in TE buffer. The optical density of the refined genomic DNA (gDNA) was quantified spectrophotometrically by the absorbance at 260 nm. The DNA globules were then dried under incubation at 2°C for more than 10 h, stored at –90°C until needed, and thawed in purified distilled water.
The oligonucleotides primers were purchased from Operon Technologies, USA. OPC-03 (5 ’ -GGGGGTCTTT-3 ’) , OPC-05 (5 ’ -GATGACCGCC-3 ’) , OPC-06 (5’-GAACGGACTC-3’), OPC-07 (5’-GTCCCGACGA-3’), and OPC-11 (5’-AAAGCTGCGG-3’) were the primers used to identify the unique loci shared within each population and the number of loci shared by the two river pufferfish populations was calculated. The oligonucleotide primers were also used to identify genetic variations, DNA polymorphisms, and pairwise similarity of the river pufferfish in the natural and the cultured fish populations. PCR analysis was performed on a programmable DNA Thermal Cycler (MJ Research, Waltham, MA, USA). DNA amplification was performed with 25 μL sample aliquots containing 10 ng of template DNA, 22 μL of premix (Bioneer, Daejeon, Korea), and 1 unit of primer. Electrophoresis of the amplification reaction was conducted for 30 min at 100 V in a 1.4% agarose (Bioneer) gel containing ethidium bromide in TBE buffer (90 mM Tris, pH 8.5; 90 mM borate; and 2.5 mM EDTA) using a 100 bp DNA ladder (Bioneer) as a DNA molecular weight marker. The electrophoresed agarose gels were irradiated with UV rays, and images were acquired using a Photoman Direct Copy System (PECA Products, Beloit, WI, USA).
Similarity matrices containing band-sharing (BS) values were designed along with or without the amplified products at specific spots in the identical gel from the DNA frameworks. The BS values estimated were consistent with those reported by Jeffreys & Morton (1987) and Yoke-Kqueen & Radu (2006). Comparing the two lanes, the BS value was calculated as follows: BS=2(Nab)/(Na+Nb), where Nab denotes the number of fragments shared by samples b and a; Na indicates the total number of fragments in a; and Nb represents the total number of fragments in sample b. The average within-population similarity was measured via pairwise parallel analysis between the individuals within a population. The relationship between different individuals in the river pufferfish populations was determined using the BS values and similarity matrices. A hierarchical polar dendrogram was constructed based on similarity matrices to yield a cluster tree using Systat version 10 (SPSS, Chicago, IL, USA). The Systat software was also used to analyze the Euclidean GDs within and between the river pufferfish populations, means, standard errors, and t-test results.
RESULTS AND DISCUSSION
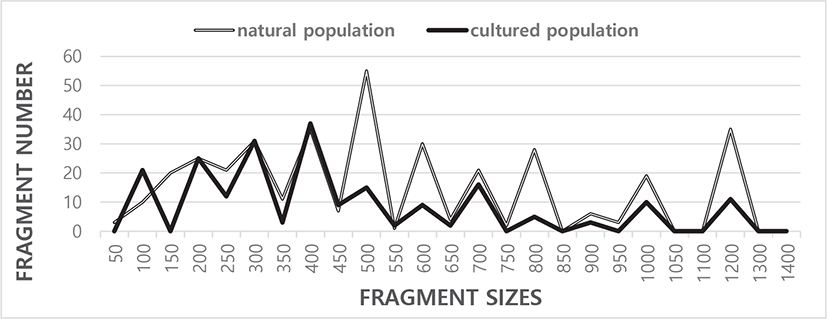
Five oligonucleotide primers OPC-03, OPC-05, OPC-06, OPC-07, and OPC-11 were used to generate the unique loci shared within each population and the loci shared by the two river pufferfish populations. The complexity of the banding profiles varied greatly between the primers derived from the two pufferfish populations. The fragment numbers in each size range were based on the integrated fragments amplified by the five oligonucleotides primers, as shown in Fig. 1. The size of the DNA fragments also varied widely, from 50 bp to 1,300 bp, as indicated in Fig. 1. Higher fragment sizes (>1,400 bp) are not recognized in the two river pufferfish populations. In this finfish, a cluster tree was constructed using the unweighted pair group method with arithmetic mean (UPGMA) Euclidean GD analysis of a total of 578 discrete fragments acquired with the five oligonucleotide primers from the two river pufferfish populations. The five oligonucleotide primers yielded a total of 367 fragments in the natural population and 211 fragments in the cultured population, with DNA fragment sizes ranging from 50 bp to 1,300 bp. The average number of distinct fragments per primer within the natural and cultured river pufferfish population was 14.68 and 8.44, respectively.
The number of fragments generated by each primer in the three endemic Spanish barbel species (Barbus bocagei, B. graellsii, and B. sclateri) varied from 17 to 30, with a mean of 24.2 bands per individual and primer (Callejas & Ochando, 1998). The number of recorded fragments fluctuated from 7 to 12 per primer in four species belonging to familye Mullidae (Mamuris et al., 1999). In teleosts, DNA fragments ranging from 350 bp to 700 bp were detected via random amplified polymorphic DNA (RAPD-PCR) analysis of barramundi (Lates calcarifer) (Partis & Wells, 1996). Tandem repeat sequences containing 290 bp to 291 bp of DNA were identified by SalI digestion of the gDNA from five species of Eastern Pacific abalone using another molecular method (genus Haliotis) (Muchmore et al., 1998). Eighty fragments ranging from 200 bp to 2,200 bp were unambiguously counted in the black tiger shrimp (Penaeus monodon) (Tassanakajon et al., 1998). The fragment size ranged from 220 bp to 1,700 bp in four species of the Mullidae family (Mamuris et al., 1999). The DNA fragments generated by four primers varied from 100 bp to 2,300 bp in the brittle star (Amphiura filiformis) (McCormack et al., 2000). A phylogenetic tree was constructed via UPGMA cluster analysis based on a total of 3,744 distinguishable fragments in gynogenetic clones from the silver crucian carp, Carassius auratus gibelio (Block) (Zhou et al., 2000). The primer OPF-10 yielded 11 amplified fragments in the eastern Pacific yellowfin tuna (Thunnus albacares), with sizes ranging from 200 bp to 600 bp (Diaz-Jaimes & Uribe-Alcocer, 2003).
The BS value between individual # 01 of the natural river pufferfish and # 22 of the cultured river pufferfish was 0.173, which was the lowest observed, as shown in Table 1. The BS value between individuals # 09 and # 10 was 0.894, which was the highest value within the natural river pufferfish population. The 88 unique loci shared between the populations generated by OPC-11 oligonucleotide primers were detected in the natural river pufferfish population, as shown in Table 2. The oligonucleotide OPC-05 primers generated 55 unique loci shared within each population, which were identified within each natural river pufferfish population (Table 2). The oligonucleotide OPC-07 primer generated 44 unique shared loci within each population of the cultured river pufferfish. The oligonucleotide OPC-05 primer revealed 44 loci shared by all the samples of the two river pufferfish populations, as major and/or minor fragments of 500 bp and 1,200 bp, respectively (Table 2). The remaining oligonucleotide primers did not reveal any loci shared by the two populations. The average number of unique loci shared within each population was diverse and 1.6-fold higher in the natural than in the cultured population. Thirty-three loci were shared by three hard clam (Meretrix lusoria) populations with an average of 4.7 per primer (Yoon et al., 2012). The decamer primer BION-B14 generated 7 unique loci of approximately 100 bp in Vietnamese cuttlefish (Sepia esculenta) populations (Yoon & Kim, 2010). Remarkably, the 21 unique shared loci within each population identified by BION-06 primer in a Sockcho cuttle fish population were approximately 100 bp, 450 bp and 650 bp in size.
Individuals in the natural river pufferfish population (0.683±0.014) had lower BS values than did individuals from the cultured river pufferfish population (0.759±0.009) (p<0.05), as shown in Table 3. The average BS value in this study was higher than the value between a common carp species and Israeli carp (0.57±0.03) (Yoon, 2001), and Geojedo oyster populations (0.537±0.017) (Kim et al., 2004). In contrast, the average BS value in this study was similar to that of Spanish barbel species (0.71–0.81) (Callejas & Ochando, 1998). A cuttlefish (Sepia esculenta) population from Sockcho (0.826) exhibited higher BS values than did fish from Seocheon (0.465) (Yoon & Kim, 2010). Polymorphisms were identified according to the banding patterns of the primer-amplified products at specific sites (Callejas & Ochando, 1998; Mamuris et al., 1999; Adams, 2000; Bartish et al., 2000; Klinbunga et al., 2000a; Nozaki et al., 2000; Yoon, 2001; Kim et al., 2004; Oh & Yoon, 2014; Yoon, 2019). Researchers analyzed the size of DNA fragments in the PCR products of black tiger shrimp (Penaeus monodon) (Tassanakajon et al., 1998), blacklip abalone (Haliotis rubra) (Huang et al., 2000), the brittle star (Amphiura filiformis) (McCormack et al., 2000), yellowfin tuna (Thunnus albacares) (Diaz-Jaimes & Uribe-Alcocer, 2003), lobster species (Park et al., 2005), crayfish (Cambaroides similis) (Kim et al., 2006), cuttlefish (Sepia esculenta) (Yoon & Kim, 2010), white clam (Meretrix lusoria) (Yoon et al., 2012), and mollusk species (Oh & Yoon, 2014). The primer revealed significant differences in individuals and populations, resulting from variations in DNA polymorphisms among individuals and populations (Callejas & Ochando, 1998; Mamuris et al., 1999; Adams, 2000; Bartish et al., 2000; Klinbunga et al., 2000a; Nozaki et al., 2000; Yoon, 2001; Kim et al., 2004; Oh & Yoon, 2014; Yoon, 2019).
| Population | Natural | Cultured |
|---|---|---|
| Natural | 0.683±0.014ab | 0.344±0.006c |
| Cultured | - | 0.759±0.009a |
Each value is a product of three disparate experiments.
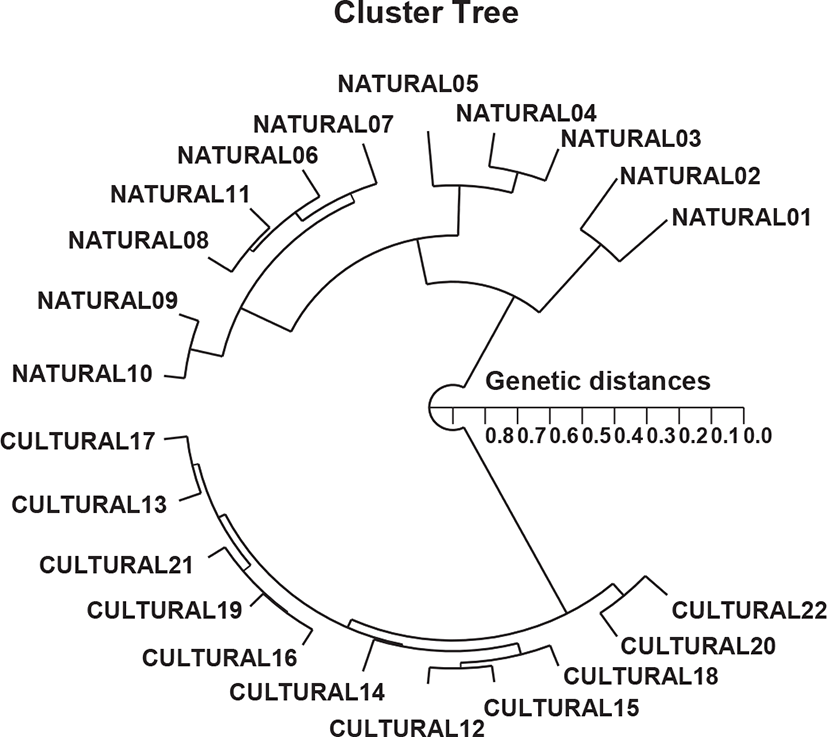
In this study, PCR analysis revealed an important GD between two population/species pairs by discriminating the two river pufferfish based on geographic differences in population, species, and genetic structure. The hierarchical polar dendrogram defined two main clusters, 1 (NATURAL 01– NATURAL 11) and 2 (CULTURED 12–CULTURED 22) from two geographic river pufferfish populations, as shown in Fig. 2. The shortest GD exhibiting significant molecular difference was between cultured individuals # 12 and 15 (GD=0.053). Ultimately, individual # 02 in the natural river pufferfish population was most distantly related to cultured individual # 22 (GD=0.827). These results indicate that the cultured river pufferfish population is genetically different from the natural river pufferfish population. A neighbor-joining tree of the GDs between three mud crab species analyzed by PCR indicated the relationships between the species (Klinbunga et al., 2000b). Large genetic differences have been reported between geographically detached populations within and between species. Phylogenetic relationships among 5 Haliotis species and one hybrid species were determined using the distance coefficient and a phylogenetic tree based on PCR data (Kim et al., 2000). Accordingly, two clusters were identified: cluster I comprising H. discus hannai, H. discus, H. gigantea, and H. sieboldii, and the hybrid, which was consecutively re-divided into two sub-clusters. The authors reported that PCR analysis was the predominant method for determining the phylogenetic relationship between 6 Haliotis species. In other invertebrates, a cluster analysis of the pairwise species matrix generated from genetic data revealed possible clustering of geographically close populations of blacklip abalone (Huang et al., 2000).
The foregoing findings indicate the potential of PCR analysis to detect diagnostic markers for the identification of two river pufferfish populations. The findings validate the method as a suitable tool for DNA evaluations, both within and between individuals, populations, and species. The classification of river pufferfish species is based on morphological variations in the tail type, body color, body size, body type, and mouth size. Differences in such traits reflect their separate origin or genetic identity (Chenyambuga et al., 2004). The population relationships indicated by PCR analysis should be consistent with previously acquired data based on morphological analysis (Nebauer et al., 2000).
In general, using several oligonucleotide primers, this PCR technique enables the determination of detailed markers specific to geographic populations, besides genetic diversity and polymorphism in individuals (Partis & Wells, 1996; Adams, 2000; Bartish et al., 2000; Kim et al., 2000; McCormack et al., 2000; Nozaki et al., 2000; Yoon & Park, 2002; Kim et al., 2004; Park et al., 2005; Yoon & Kim, 2010; Hur et al., 2012; Yoon et al., 2012; Song & Yoon, 2013; Yoon, 2019). Data highlighting the GD of the river pufferfish can be used to determine the increase in individual population as well as the conservation efforts in the inshore and river areas of the Korean peninsula. Nonetheless, additional studies involving larger number of individuals, primers, populations, species, and genera are required to definitively construct the loci for specific taxa and the subsequent interspecific gene flow in the genus Takifugu. Advanced studies including a large number of individual samples and primers are needed to acquire comprehensive data related to the genetic structure of the two river pufferfish populations.