Development & Reproduction
Korean Society of Developmental Biology
Short communication

Genetic Distances between Tailfin Anchovy (Coilia nasus) Populations Analyzed by PCR

Soo-Gun Jo1https://orcid.org/0000-0001-7397-842X, Jong-Man Yoon2,https://orcid.org/0000-0003-2825-681X
1Dept. of Biotechnology, College of Ocean Science and Technology, Kunsan National University, Gunsan 54150, Korea
2Dept. of Aquatic Life Medicine, College of Ocean Science and Technology, Kunsan National University, Gunsan 54150, Korea
Corresponding author Jong-Man Yoon, Department of Aquatic Life Medicine, College of Ocean Science and Technology, Kunsan National University, Gunsan 54150, Korea. Tel: +82-63-469-1887, E-mail: jmyoon@kunsan.ac.kr

Copyright © 2021 The Korean Society of Developmental Biology. This is an Open Access article distributed under the terms of the Creative Commons Attribution Non-Commercial License (http://creative-commons.org/licenses/by-nc/4.0/) which permits unrestricted non-commercial use, distribution, and reproduction in any medium, provided the original work is properly cited.

Received: Jan 07, 2021 ; Revised: Jan 24, 2021 ; Accepted: Feb 12, 2021

Published Online: Mar 31, 2021

Abstract

The author established a PCR-based genetic platform to examine the hierarchical polar dendrogram of Euclidean genetic distances of one tailfin anchovy population, especially for Coilia nasus, which was further associated with other fish population, by connecting with specifically designed oligonucleotide primer sets. Five oligonucleotide primers were used to generate a total of 260 and 211 scorable fragments in Coilia populations I and II, respectively. The DNA fragments ranged from greater than (approximately) 100 to more than 2,000 bp. The average bandsharing values (BS) of individuals from the anchovy population I (0.693) displayed higher values than individuals from population II (0.675). The genetic distance between individuals established the existence of a close relationship in group II. Comparatively, individuals of one anchovy population were fairly related to other fish populations, as shown in the polar hierarchical dendrogram of Euclidean genetic distances. The noteworthy genetic distance determined between two Coilia nasus populations demonstrates that this PCR technique can be applied as one of the several devices for individuals and/or population biological DNA researches undertaken for safeguarding species and for production of anchovies in the littoral area of Korea.

Keywords: Coilia nasus; Euclidean genetic distances; Hierarchical polar dendrogram; Tailfin anchovy

INTRODUCTION

Coilia nasus is an ecologically important teleost species, belonging to the family Engraulidae, order Clupeiformes. It is found broadly distributed on the Yellow Sea seashore of Korea, Japan, and China (Lee et al., 2003). In the natural environment, the fish inhabit the brackish water and seashores that contain plentiful sand and slime. Similar to other fish, the rate of fish growth is greatly influenced by the water quality. The outer body color of Coilia nasus is silver, the dorsal body color is dense blue, and the abdomen is silver or grey. Ecological environments of the habitat, such as water temperature, feed, prey and severe conditions, are largely responsible for marked shifts in the fish shape, size, weight and color of Coilia nasus. The tailfin anchovy is an ecologically and biologically very important fish in Korea. The finfish are reproductively (Lee et al., 2003; Jun et al., 2009; Kwun, 2012), morphologically (Kwun et al., 2010; Jiang et al., 2011), ecologically (Baeck et al., 2011), as well as histologically (Jun et al., 2003) well-documented, but their genetics and/or molecular-biology studies are not comparable to other fish. Therefore, in order to evaluate the exact patent genetic consequence, there is a necessity to understand the genetic traits and composition of this finfish population. PCR-based molecular research methods have been applied to study the genetic characters of various finfish and shellfish (Zhou et al., 2000; Mamuris et al., 2005; Park et al., 2005; Kim et al., 2006; Yoon & Kim 2010; Yoon et al., 2012; Oh & Yoon, 2014; Yoon, 2018; Yoon, 2020). Largely, This PCR method is one of fastest and simplest research methods to identify genetic difference and the polymorphism in various organisms that does not require the prior knowledge of the genomic DNA (Bommineni et al., 1997; Mamuris et al., 2005). In general, using the markers peculiar to the species, the genus or the geographical populations have been applied for monitoring individuals, species, and hybrid parentage, and security of DNA markers. To elucidate the Euclidean genetic distances in tailfin anchovy, the author of the current study applied clustering analyses within and/or between two geographical populations of tailfin anchovies (Coilia nasus) inhabiting the Yellow Sea areas of Korea.

MATERIALS AND METHODS

PCR analysis was accomplished on DNA samples extracted from a total of 22 individual fish using five oligonucleotide primers. DNA extraction was performed by applying the separation and extraction methods (Yoon & Kim, 2010). Briefly, 600 µL of chloroform was added to the mixture and subsequently inverted (no phenol). After few washes, lysis buffer Ⅰ (155 mM NH4Cl; 10 mM KHCO3; 1 mM EDTA) was added to the samples, and the mixture tubes were gently mixed. The precipitates obtained were centrifuged and suspended in lysis buffer II (10 mM Tris-HCl, pH 8.0; 10 mM EDTA; 100 mM NaCl; 0.5% SDS). Subsequently, 15 µL proteinase K solution (10 mg/ mL) was added to this mixture. After incubation for overnight, 300 µL 3 M NaCl was added and gently mixed by pipetting for a few minutes, followed by addition of 600 µL chloroform; tubes were inverted to facilitate mixing. Ice-cold 70% EtOH was then added to the tubes, and samples were centrifuged at 19,621 g for 5 minutes to extract DNA from the lysates. Using a spectrophotometer (Beckman Coulter, Buckinghamshire, UK), the concentration of the extracted genomic DNA was measured at optical density (O.D.) 260 nm. The DNA pellets were then subjected to dry incubation for more than 12 hours, and subsequently maintained at –70℃ until required; pellets were dissolved in distilled water before use. DNA amplification was performed in 25 µL volume containing 10 ng template DNA, 20 µL premix (Bioneer, Daejeon, Korea) and 1.0 unit primer. Amplification products were separated by 1.4% agarose (Bioneer) gel electrophoresis using TBE (90 mM Tris, pH 8.5; 90 mM borate; 2.5 mM EDTA). The 100 bp DNA ladder (Bioneer) was used as the DNA molecular weight marker. The electrophoresed agarose gels were stained with ethidium bromide (Song & Yoon, 2013), followed by illumination with ultraviolet rays, and imaging using a photoman direct copy system (PECA Products, Beloit, WI, USA). Oligonucleotide primers (Operon Technologies, Alameda, CA, USA) were utilized in this study; OPC-04 (5’-CCGCATCTAC-3’), OPC-05 (5’-GATGACCGCC-3’), OPC-09 (5’-CTCACCGTCC-3’), OPC-13 (5’-AAGCCTCGTC-3’), and OPC-14 (5’-TGCGTGCTTG-3’) exhibited bandsharing values (BSs) and genetic variations of the two tailfin anchovy populations. Thus, the author used the five oligonucleotide primers to determine the genetic variations and DNA polymorphisms of the tailfin anchovy population. PCR was carried out using a programmable DNA Thermal Cycler (MJ Research, Waltham, MA, USA). Similarity matrix, including BSs between different individuals in the two Coilia nasus populations, was generated by applying the formula of Jeffreys and Morton (1987), and Yoke-Kqueen & Radu (2006). A hierarchical clustering tree was conceived using similarity matrices to yield a dendrogram, which was supported by the Systat version 10 (SPSS, Chicago, IL, USA).

RESULTS AND DISCUSSION

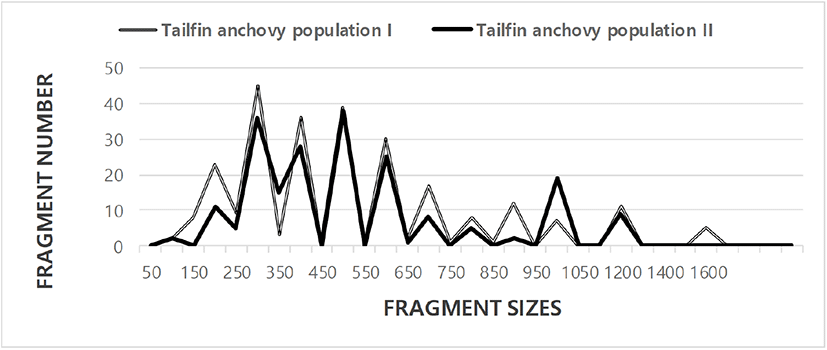
In this study, BS based on the presence or absence of amplified fragments was utilized to calculate the similarity indices (Tables 1 and 2). Here, the complexity of the banding patterns varied dramatically between primers from the two finfish populations. The fragment numbers in each size interval were computed from the integrated fragments obtained with every five oligonucleotide primers, as shown in Fig. 1. Higher fragment sizes (>1,600 bp) are observed in the tailfin anchovy population I. There are found the sizes of the DNA fragments 220 bp to 1,700 bp in the Mullidae family (Mamuris et al., 2005).

dr-25-1-59-g1
Fig. 1. Distribution of fragment sizes of tailfin anchovy populations I and II from Gunsan. Solid grey lines: Tailfin anchovy population I (TAILFIN ANCHOVY 01, 02, 03, 04, 05, 06, 07, 08, 09, 10, and 11). Solid black lines: Tailfin anchovy population II (TAILFIN ANCHOVY 12, 13, 14, 15, 16, 17, 18, 19, 20, 21, and 22). The fragment numbers in each size interval have been computed from the integrated fragments obtained with every five oligonucleotide primers. Higher fragment sizes (>1,600 bp) are observed in the tailfin anchovy population I.
Download Original Figure

The similarity matrix, which was based on the average BS of all the samples, ranged from 0.547 to 0.896 in the tailfin anchovy population I (average, 0.693±0.011), and 0.465 to 1.0 in the tailfin anchovy population II (average, 0.675±0.013) (Tables 1 and 2). The BS between the two tailfin anchovy populations ranged from 0.322 to 0.723, with an average of 0.558±0.008. The highest BS (1.000) between the two tailfin anchovy populations was obtained for sample numbers 19 and 20, whereas the lowest value (0.322) was determined between samples numbers 08 and 18. Matched individually, BSs of the individual tailfin anchovy population I (0.693) were higher than population II (0.675). The average BS obtained using the five random primers was 0.690±0.080 in the cultured crucian carp species. The average BS reported by this study is lower than values obtained for the zebu cattle breeds (0.730 to 0.790) (Gwakisa et al., 1994), cattle breeds (0.920) (Sharma et al., 2004), and two bastard halibut populations (Yoon, 2018). In contrast, the average BS of the current study is higher than the turkey lines (0.202 to 0.230) (Ye et al., 1998), common carp and Israeli carp (0.570±0.030) (Yoon, 2001). The average BS recorded in our study is also higher than the average value between the bullhead population (0.504±0.115) (Yoon & Kim, 2004).

Table 1. Trigonal similarity matrix containing bandsharing values calculated using Nei and Li's index of the similarity of two tailfin anchovy (Coilia nasus) populations from Gunsan district of Korea
Bandsharing values of tailfin anchovy population I Bandsharing values of tailfin anchovy population II
1 2 3 4 5 6 7 8 9 10 11 12 13 14 15 16 17 18 19 20 21 22
1 - 0.809 0.836 0.636 0.636 0.697 0.753 0.590 0.639 0.701 0.686 0.723 0.644 0.609 0.565 0.675 0.657 0.646 0.620 0.685 0.673 0.605
2 - 0.793 0.761 0.615 0.652 0.735 0.630 0.617 0.641 0.669 0.665 0.517 0.528 0.470 0.537 0.538 0.541 0.606 0.606 0.574 0.575
3 - 0.896 0.670 0.660 0.847 0.688 0.775 0.733 0.641 0.662 0.605 0.591 0.517 0.551 0.580 0.556 0.571 0.618 0.591 0.703
4 - 0.656 0.714 0.791 0.710 0.756 0.763 0.634 0.686 0.601 0.628 0.552 0.557 0.646 0.606 0.688 0.603 0.565 0.591
5 - 0.547 0.627 0.551 0.563 0.547 0.597 0.513 0.433 0.437 0.467 0.386 0.424 0.424 0.459 0.434 0.396 0.407
6 - 0.768 0.674 0.754 0.723 0.689 0.608 0.596 0.546 0.529 0.636 0.574 0.564 0.552 0.550 0.48 0.476
7 - 0.608 0.728 0.720 0.671 0.585 0.583 0.564 0.527 0.547 0.579 0.568 0.549 0.632 0.561 0.480
8 - 0.693 0.687 0.590 0.553 0.429 0.405 0.390 0.371 0.415 0.322 0.433 0.384 0.345 0.495
9 - 0.874 0.800 0.646 0.584 0.717 0.590 0.588 0.619 0.545 0.569 0.630 0.634 0.535
10 - 0.674 0.659 0.582 0.653 0.592 0.616 0.608 0.612 0.564 0.569 0.509 0.579
11 - 0.628 0.619 0.690 0.567 0.579 0.571 0.551 0.478 0.383 0.531 0.566
12 - 0.742 0.631 0.606 0.638 0.683 0.597 0.679 0.627 0.620 0.674
13 - 0.711 0.733 0.692 0.762 0.562 0.66 0.605 0.550 0.575
14 - 0.775 0.634 0.787 0.667 0.655 0.641 0.606 0.892
15 - 0.614 0.756 0.702 0.620 0.627 0.562 0.465
16 - 0.831 0.826 0.695 0.648 0.726 0.745
17 - 0.600 0.827 0.686 0.682 0.695
18 - 0.660 0.646 0.642 0.633
19 - 1.000 0.567 0.777
20 - 0.772 0.494
21 - 0.596
22 -
Download Excel Table
Table 2. Manifold scheming of average bandsharing values (mean±SE) between two tailfin anchovy populations were generated according to the bandsharing values and similarity matrix
Population Tailfin anchovy I Tailfin anchovy II
Tailfin anchovy I 0.693±0.011a 0.558±0.008b
Tailfin anchovy II - 0.675±0.013a

Each value is a result of three different experiments.

Values with different superscript are significantly different (p<0.05).

Download Excel Table

The primer OPC-05 generated 33 unique loci shared to each population, which were determining each population, approximately 200 bp, 300 bp, and 500 bp, respectively, in the tailfin anchovy population I, as demonstrated in Table 3. Also, the primer OPC-13 discovered 44 loci shared by the two tailfin anchovy populations, major and/or minor fragments of sizes 400 bp and 600 bp, respectively, which were comparable in all samples. Five oligonucleotide primers exposed 26.4 loci shared by the two tailfin anchovy populations. The average number of unique loci shared within each population was varied and 1.5-fold higher in the population I than in the population II. The oligonucleotides primer BION-B14 generated 7 unique loci of approximately 100 bp in Vietnamese cuttlefish (Sepia esculenta) populations (Yoon & Kim, 2010). Twenty-one unique loci identified by the BION-06 primer in a Sockcho cuttle fish population were approximately 100 bp, 450 bp, and 650 bp in size. Thirty-three loci were shared by three hard clam (Meretrix lusoria) populations with an average of 4.7 per primer (Yoon et al., 2012).

Table 3. The number of unique loci shared to each population and number of loci shared by the two populations attained by DNA analysis with 5 oligonucleotides primers in two tailfin anchovy populations from Gunsan district of Korea
Primer No. of unique loci shared to each population No. of loci shared by the two anchovy populations
Tailfin anchovy population I Tailfin anchovy population II Two tailfin anchovy populations
OPC-04 22 11 22
OPC-05 33 0 44
OPC-09 11 11 0
OPC-13 22 22 44
OPC-14 11 22 22
Total no. 99 66 132
Average no. per primer 19.8 13.2 26.4
Download Excel Table

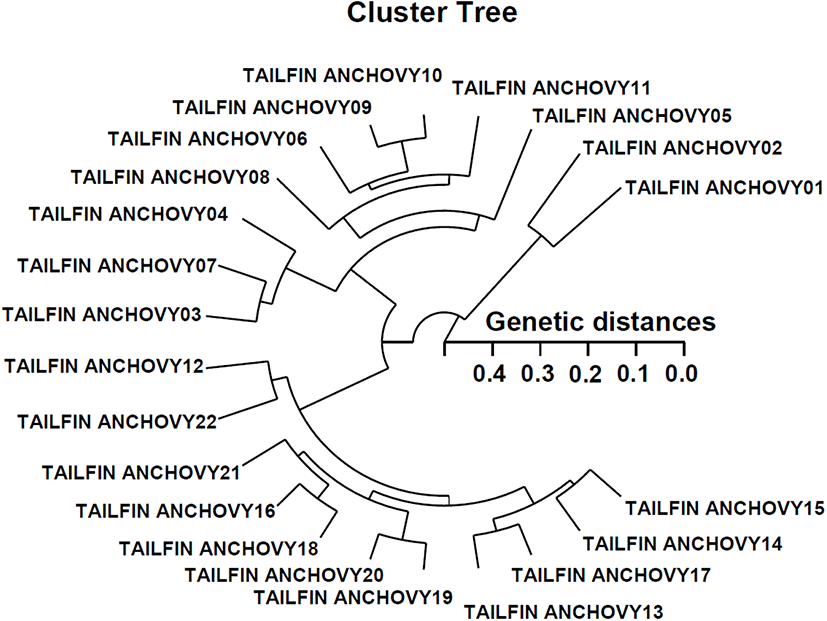
In this study, the polar hierarchical polar dendrogram obtained by the five oligonucleotide primers classified two genetic clusters: group 1 (TAILFIN ANCHOVY 01, 02, 03, 04, 05, 06, 07, 08, 09, 10, and 11) and group 2 (TAILFIN ANCHOVY 12, 13, 14, 15, 16, 17, 18, 19, 20, 21, and 22) (Fig. 2). Among the 22 fish examined, the shortest genetic distance that exhibited meaningful molecular differences was between individual fish numbers 10 and 09 from group I (genetic distance=0.051), while the longest genetic distance that exhibited considerable molecular differences was obtained between individual fish numbers 02 and 05 (genetic distance=0.435). Individuals of group I were also found to be closely related to group II, as seen in the polar dendrogram of Euclidean genetic distances. The genetic distance between individuals thus validated the existence of a close relationship in group II. The values of the pairwise comparisons of unbiased genetic distance between populations of the Indian major carp (Catla catla) from the combined data for the four primers, ranged from 0.025 to 0.052 (Islam et al., 2005). They reported that the Padma and the Jamuna populations were separated from each other with the lowest genetic distance (D=0.025).

dr-25-1-59-g2
Fig. 2. Hierarchical polar dendrogram of genetic distances obtained from two Coilia nasus populations. The likeness between dissimilar individuals of two tailfin anchovy populations from group I (TAILFIN ANCHOVY 01, 02, 03, 04, 05, 06, 07, 08, 09, 10, and 11) and group II (TAILFIN ANCHOVY 12, 13, 14, 15, 16, 17, 18, 19, 20, 21, and 22) are accomplished according to the bandsharing values and similarity matrix.
Download Original Figure

Taken together, the data obtained in the current study establishes the perspective of this research method for determining the diagnostic markers for stock, species, genus and geographic population identification of finfish (Zhou et al., 2000; Yoon & Kim, 2004; Mamuris et al., 2005; Yoon, 2018; Yoon, 2020), shellfish (Kim et al., 2004; Kim et al., 2006; Yoon et al., 2012; Song & Yoon, 2013; Oh & Yoon, 2014), in plant (Bommineni et al., 1997), and livestock (Jeffreys & Morton, 1987; Gwakisa et al., 1994; Ye et al., 1998; Sharma et al., 2004; Islam et al., 2005). The points of considerable genetic distance between two Coilia nasus populations proves that this PCR system is one of the several strategies for individual and/or population genetic DNA studies. Further examination using greater sample numbers, primers, populations, species, and genera is required to entirely create the specificity of loci to well-defined taxa, and consecutive inter-separate gene flow in the genera Coilia.

Conflict of interests

The authors declare no potential conflict of interest.

Acknowledgements

Not applicable.

Authors’ contributions

Conceptualization: Jo SG, Yoon JM

Data curation: Jo SG, Yoon JM

Formal analysis: Jo SG, Yoon JM

Methodology: Jo SG, Yoon JM

Software: Jo SG, Yoon JM

Validation: Jo SG, Yoon JM

Investigation: Jo SG, Yoon JM

Writing-original draft: Jo SG, Yoon JM

Writing-review & editing: Jo SG, Yoon JM

Ethics approval

This article does not require IRB/IACUC approval because there are no human and animal participants.

References

1.

Baeck GW, Park JM, Choo HG, Hur SH. 2011; Diet composition of Coilia nasus in the coastal waters off Gori, Korea. Korean J Ichthyol. 23:163-167.

2.

Bommineni VR, Jauhar PP, Peterson TS, Chibbar RN, Almouslem AB. 1997; Analysis of hybrids of durum wheat with Thinopyrum junceiforme using RAPD markers. Theor Appl Genet. 95:757-763

3.

Gwakisa PS, Kemp SJ, Teale AJ. 1994; Characterization of Zebu cattle breeds in Tanzania using random amplified polymorphic DNA markers. Anim Genet. 25:89-94

4.

Islam MS, Ahmed ASI, Azam MS, Alam MS. 2005; Genetic analysis of three river populations of Catla catla (HAMILTON) using randomly amplified polymorphic DNA markers. Asian-Australas J Anim Sci. 18:453-457

5.

Jeffreys AJ, Morton DB. 1987; DNA fingerprints of dogs and cats. Anim Genet. 18:1-15.

6.

Jiang T, Yang J, Liu HB. 2011; A comparative study of the morphology of sagittal otolith in Coilia nasus, Coilia mystus and Coilia nasus taihuensis. Mar Sci. 35:31-35.

7.

Jun JC, Kang HW, Lee BW. 2009; Maturation and spawning of the Korean anchovy Coilia nasus on the west coast of Korea. Dev Reprod. 13:123-132.

8.

Jun JC, Jung EY, Lee JY. 2003; Histological study on the reproductive cycle of Coilia nasus. J Aqua. 16:179-186.

9.

Kim JY, Park CY, Yoon JM. 2004; Genetic differences and DNA polymorphism in oyster (Crassostrea spp.) analysed by RAPD-PCR. Korean J Genet. 26:123-134.

10.

Kim S, Kim YH, Yoon JM. 2006; Genetic variation in geographic crayfish (Cambaroides similis) populations. J Fish Pathol. 19:141-153.

11.

Kwun HJ, Kim YH, Kim JB, Jeong CH, Kim JK. 2010; One unusual species, Coilia sp. (Engraulidae, Pisces) from the Yellow Sea. Anim Cells Syst. 14:137-145

12.

Kwun NL. 2012 The morphological development of larvae and juveniles of the estuary tailfin anchovy, Coilia nasus from Korea. M.S. Thesis. Pukyong Natinal University. Busan, Korea: .

13.

Lee BW, Chung EY, Lee JY. 2003; Histological study on the reproductive cycle of Coilia nasus. J Aquacult. 16:179-186.

14.

Mamuris Z, Stamatis C, Bani M, Triantaphyllidis C. 2005; Taxonomic relationships between four species of the Mullidae family revealed by three genetic methods: Allozymes, random amplified polymorpic DNA and mitochondrial DNA. J Fish Biol. 55:572-587

15.

Oh H, Yoon JM. 2014; Genetic distances of three mollusk species investigated by PCR analysis. Dev Reprod. 18:43-49

16.

Park SY, Park JS, Yoon JM. 2005; Genetic differences and variations in slipper lobster (Ibacus ciliatus) and deep sea lobster (Puerulus sewelli) determined by RAPD analysis. Korean J Genet. 27:307-317.

17.

Sharma AK, Bhushan B, Kumar S, Kumar P, Sharma A, Kumar S. 2004; Molecular characterization of Rathi and Tharparkar indigenous cattle (Bos indicus) breeds by RAPD-PCR. Asian-Australas J Anim Sci. 17:1204-1209

18.

Song YJ, Yoon JM. 2013; Genetic differences of three Pollicipes mitella populations identified by PCR analysis. Dev Reprod. 17:199-205

19.

Ye X, Zhu J, Velleman G, Nestor KE. 1998; Genetic diversity of commercial turkey primary breeding lines as estimated by DNA fingerprinting. Poult Sci. 77:802-807

20.

Yoon JM. 2001; Genetic similarity and difference between common carp and Israeli carp (Cyprinus carpio) based on random amplified polymorphic DNAs analyses. Korean J Biol Sci. 5:333-339

21.

Yoon JM, Kim JY. 2004; Genetic differences within and between populations of Korean catfish (S. asotus) and bullhead (P. fulvidraco) analysed by RAPD-PCR. Asian-Australas J Anim Sci. 17:1053-1061

22.

Yoon JM, Kim JY. 2010; Genetic differences and geographic variation in cuttle fish (Sepia esculenta Hoyle). Dev Reprod. 14:163-170.

23.

Yoon JM, Park KI, Choi SH. 2012; Variation of shell color in three geographic white clam (Meretrix lusoria) populations of the Yellow Sea. Dev Reprod. 16:47-51

24.

Yoon JM. 2018; Genetic distances of Paralichthys olivaceus populations investigated by PCR. Dev Reprod. 22:283-288

25.

Yoon JM. 2020; Genetic distances of rainbow trout and masu salmon as determined by PCR-based analysis. Dev Reprod. 24:241-248

26.

Yoke-Kqueen C, Radu S. 2006; Random amplified polymorphic DNA analysis of genetically modified organisms. J Biotechnol. 127:161-166

27.

Zhou L, Wang Y, Gui JF. 2000; Analysis of genetic heterogeneity among five gynogenetic clones of silver crucian carp, Carassius auratus gibelio Bloch, based on detection of RAPD molecular markers. Cytogenet Cell Genet. 88:133-139