
INTRODUCTION
The particular markers definite to breed, species, genus or geographical group have been engaged in the identification of parties, species and populations and genetic diagnostics (Archak et al., 2003; Nagarajan et al., 2006; Yoon et al., 2006; Kim & Yoon, 2018; Yoon, 2019a). So far, specific fragments (FMs) created by PCR by means of primers were deliberated to be a trustworthy method for discovering DNA relationship between organisms (Eujayl et al., 1998; Almeida et al., 2003; Archak et al., 2003; Liu & Cordes, 2004; Wang & Li, 2004; Wasko et al., 2004; Bernardet et al., 2005; Yamazaki et al., 2005; Yue & Orban, 2005; Nagarajan et al., 2006; Yoon et al., 2006).
Blue crab (Portunus trituberculatus) is the most commonly eaten portunid crab in Korea all the year round, owing to the sweet taste. The crab is one of economically important crab species, belonging to the family Portunidae, and the order Decapoda. In the natural ecosystem, blue crab is widely distributed in the seawater areas of the Korean peninsula, as well as in several areas in China, Japan, Taiwan and the Americas. Morphologically, the crab has very large and long both claws and the body color of this crab is dark purple with blue patterns. An investigate has shown that water temperature, feed volume, water width and salinity factors are critical in the early larval development of this portunid crab (Pyen, 1970). Largely, the dimension, style and pigment of this crab species differs along with territory, such as marsh and seawater zone, the nourishment, water temperature, and other shared factors. The preservative desires and tolerances of the crab species from different geographic areas are currently unknown, as is crab species discernment. As the crab culture industry develops, the comprehension of the inheritances of this crab species becomes more necessary; to evaluate the veiled genetic properties induced by crab production tasks.
There have been few genetic and molecular-biological studies of this kind of invertebrates, which are acknowledged as significant alimentary (Cho, 2007; Kim & Park, 2014), environmentally (Kang, 1997; Yeon et al., 2011), managementally (Lee & Yang, 2005), phylogenetically (Cho et al., 2009), and reproductively (Seo et al., 2009; Jo et al., 2013) compared to other crustacean species. Nonetheless, notwithstanding their commercial and technical values, a little report data presently exist about the genetics and early development of this crab species in Korea. So, there is a necessity to comprehend the genetic traits and more information of this crab group so as to assess accurately the precisely inherited implication.
This study efforts to explicate the genetic distances (GD) and differences within and between blue crab groups. In order to accomplish this, this author performed clustering analyses of blue crab (P. trituberculatus) in the Yellow Sea of Korea.
MATERIALS AND METHODS
Two groups of blue crab (P. trituberculatus) were obtained from Taean of the Yellow Sea of Korea. Two groups of crab muscle was collected in sterile tubes, immediately placed on freezing materials, and deposited at –79℃ up to necessary. PCR study was executed the genomic DNAs from 22 parties, utilizing altered five primers. The extraction/purification of genomic DNA was performed under the conditions described previously (Yoon et al., 2012). Proteinase K solution was added to the tubes and gently pipetted for a few minutes.
The G+C content of the oligonucleotides primers (Operon Technologies, Alameda, CA, USA) was between 60%–70%. OPA-05 (5’-AGGGGTCTTG-3’), OPB-06 (5’-GGTGACGCAG-3’), OPD-01 (5’-ACCGCGAAGG-3’), OPD-07 (5’-TTGGCACGGG-3’), and OPD-14 (5’-CTTCCCCAAG-3’) were the primers used to identify the unique loci shared to each group (ULSEG) and the number of loci shared by the two crab groups (LSTG) was calculated. PCR analysis was performed on an input DNA thermal cycler (MJ Research, Waltham, MA, USA). DNA amplification was performed with 25 µL sample tubes containing 10 ng of template DNA, 22 µL of premix (Bioneer, Daejeon, Korea), and 1 unit of primer. PCR products of the amplification reaction were separated by electrophoresis for 30 min at 100 V in a 1.4% agarose gel, stained with ethidium bromide and visualized under UV light, and photographed on a transilluminator using a gel documentation system (PECA Products, Beloit, WI, USA).
Similarity matrices were established based on the data of band-sharing (BS) rates constructed by molecular analysis. Comparing the two lanes, the BS rate was calculated as follows: BS = 2 (Nab) / (Na + Nb), where Nab designates the number of FMs shared by examples b and a; Na indicates the total number of FMs in a; and Nb represents the total number of FMs in example b. The average within-group correspondence was measured via pairwise parallel analysis between the parties within a group. A hierarchical polar dendrogram was constructed based on similarity matrices to yield a cluster tree using Systat version 10 (SPSS, Chicago, IL, USA).
RESULTS AND DISCUSSION
Genomic DNA isolated from two groups of blue crab (P. trituberculatus) was amplified several times by PCR reactions. The complexity of the banding profiles varied greatly between the primers derived from the two blue crab groups. Generally speaking, using a variety of primers, PCR has been applied to identify polymorphic/specific markers particular to breed, line, species and geographical group, for identification of inherited multiplicity in varied species of entities (Eujayl et al., 1998; Almeida et al., 2003; Araneda et al., 2005; Bernardet et al., 2005; Yamazaki et al., 2005; Yoon et al., 2006; Yoon, 2019a&b).
The FM numbers in each scale range were based on the integrated FMs amplified by the five primers, as shown in Fig. 1. The scale of the DNAFRs also varied widely, from 100 bp to 2,000 bp, as indicated in Fig. 1. Higher FM scales (>2,000 bp) are not observed in the two blue crab groups. These results, in fact, indicate that the genome scales of blue crab are in line with to those of the blue catfish (Liu et al., 1998), yellowfin tuna (Diaz-Jaimes & Uribe-Alcocer, 2003), long-fin carp (Wang & Li, 2004), masu salmon (Yamazaki et al., 2005), crayfish (Yoon et al., 2006), cuttlefish (Yoon & Kim, 2010), and white clam (Yoon et al., 2012), and masu salmon (Yoon, 2020). With respect to various fishes, it has been reported that the number of amplified bands varied from three to eight, with the scale range varying from 500 to 3,530 bp in three Channa punctatus groups (Nagarajan et al., 2006). They stated that the total number of bands observed ranged from 34 in the Quilon group to 37 in the Thirunelveli group. Polymorphisms are determined by primers or/and by the banding patterns of amplified products at specific positions (Eujayl et al., 1998; Yoon & Kim, 2001; Diaz-Jaimes & Uribe-Alcocer, 2003; Wang & Li, 2004; Wasko et al., 2004; Araneda et al., 2005; Yamazaki et al., 2005; Yoon et al., 2006; Yoon & Kim, 2010; Yoon et al., 2012; Yoon, 2019a).
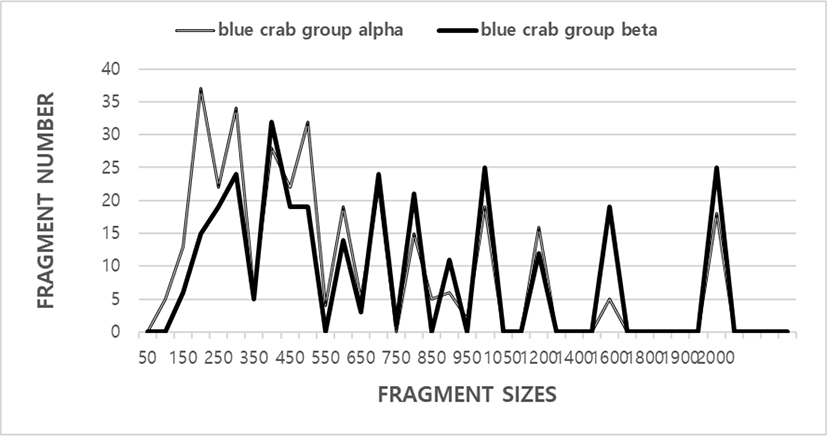
The five oligonucleotide primers yielded a total of 335 FMs (52.9%) in the blue crab group alpha and 298 FMs (47.1%) in the blue crab group beta, with DNA FM scales ranging from 100 bp to 2,000 bp. The total number of bands observed ranged from 34 in the Quilon group to 37 in the Thirunelveli group (Nagarajan et al., 2006). DNA FM scales varied from 50 bp to 1,600 bp. It has been reported that seven primers generated the scales of the DNA FMs also varied wildly, from 90 to 2,400 bp from the G. vermiculophylla (GRV) and G. chorda (GRC) (Kim & Yoon, 2018). Group-related PCR FMs were identified in the Oujiang color carp (Wang & Li, 2004) and the F1 hybrids of masu salmon Oncorhynchus masou masou and amago salmon O. m. ishikawae (Yamazaki et al., 2005). The frequencies of FMs generated by six primers were calculated in multiple catfish groups, as described in catfish (Liu et al., 1998).
The BS rate between party no. 01 of the blue crab group alpha and no. 19 of blue crab group beta was 0.094 that the lowermost was detected, as shown in Table 1. The BS rate between party’s no. 19 and no. 20 was 0.907, which was the highest rate within the blue crab group beta. The five oligo-primers OPA-05, OPB-06, OPD-07, OPD-14, and OPD-01 were used to generate the number of ULSEG and number of LSTG. The 33 ULSEG in the blue crab sample generated by the OPD-07 primer were approximately 800 bp, 1,000 bp, and 1,600 bp in scale (Table 2). 55 ULSEG, with an average of 11 per primer, were detected in the blue crab group alpha. 88 FMs, with a mean of 17.6 per primer, were identified in the blue crab group beta. The oligonucleotide primer OPB-06 produced 22 ULSEG in the blue crab group alpha example and were about 150 bp and 200 bp in scale. The oligonucleotide OPD-01 primer uncovered 22 loci shared by all the samples of the two blue crab groups, as FMs of 1,000 bp (Table 2). The oligo-primer OPA-05 made ULSEG, almost 400 bp and 500 bp, separately, in blue crab group beta. The remaining oligonucleotide primers did not reveal any loci shared by the two crab groups.
ULSEG, unique loci shared to each group; LSTG, loci shared by the two groups.
BS, band-sharing..
The average number of ULSEG was diverse and 1.6-fold higher in the crab group beta than in the crab group alpha. It has been reported that the initial screening of the 440 DNA primers identified 29 potential polymorphic markers associated with high or low color breeding values (Araneda et al., 2005). Also, only one primer showed a consistent amplification pattern (FM scale approximately 550 bp) associated with high color breeding value. Especially, only 6 of 16 salmon of low color breeding value showed the marker associated with color breeding value in the experimental group. Nagarajan et al. (2006) is stated that 14 were of a polymorphic nature and six were group-specific bands (distinctive bands) among the 42 DNA bands. Of the six group-specific bands, the Coimbatore group had five bands, whereas the Thirunelveli group had only one band. They proposed that the polymorphic and distinctive DNA bands can be used as genetic markers to select the breeders from the desired group for the purpose of selective breeding programs and to monitor the level of DNA variability in the wild or cultured group of the species.
Parties in the blue crab group beta (0.601±0.017) had higher BS rates than did parties from the blue crab group alpha (0.563±0.017) (p<0.05), as established in Table 3. The reported BS rates between the two crab groups are inconsistent with the previously reported results (Yoon, 2020). To illustrate, the average BS rate illustrated by my study is also lower than the value reported for Chinese (0.788±0.014) Urechis spp. groups (Yoon, 2019b), and masu salmon group (0.704) (Yoon, 2020).
Each value is a result of three different experiments.
BS, band-sharing
| Group | Group alpha | Group beta |
|---|---|---|
| Group alpha | 0.563±0.017b | 0.435±0.010c |
| Group beta | - | 0.601±0.017a |
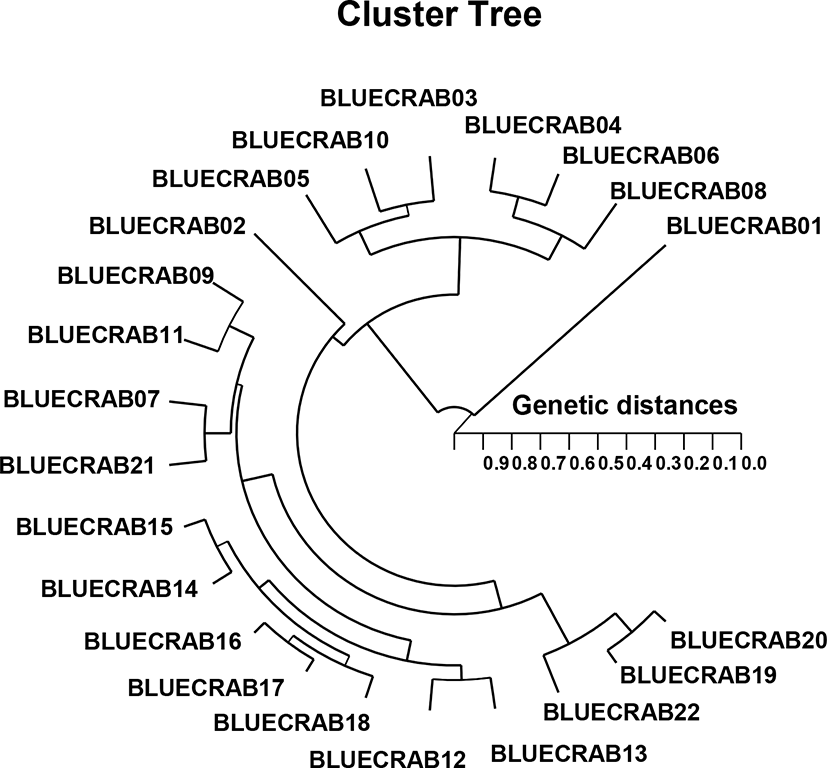
The clustering analysis showed the GD of the two groups through a polar dendrogram obtained by the five oligo-primers. The dendrogram indicates two genetic groups such as cluster I (BLUECRAB 01, 03, 04, 05, 06, 08, and 10) and cluster II (BLUECRAB 02, 07, 09. 11, 12, 13, 14, 15, 16, 17, 18, 19, 20, 21, and 22), as shown in Fig. 2. The shortest genetic distance revealing significant molecular difference was between blue crab parties no. 17 and 16 (GD=0.050). Ultimately, party no. 11 in the blue crab group was utmost remotely linked to blue crab party no. 01 (GD=0.906). In teleost, this clustering analysis discovered a pattern in line with the one posited by Nagarajan et al. (2006). Among the three Channa punctatus groups collected from three rivers of south India, the highest genetic identity (GD=0.9231) was found between Thirunelveli and Quilon groups (Nagarajan et al., 2006). They also demonstrated that Thirunelveli and Quilon groups are more related to each other than to the Coimbatore group. This study showed that large genetic differences could be found between geographical groups within a group, as well as between groups.
Various researchers analyzed the scale of DNA FMs in the PCR products of lentil (Lens spp.) (Eujayl et al., 1998), yellowfin tuna (Thunnus albacares) (Diaz-Jaimes & Uribe-Alcocer, 2003), Amazonian fish matrincha (Brycon cephalus) (Wasko et al., 2004), Chryseobacterium strains (Bernardet et al., 2005), spotted murrel (Channa punctatus) (Nagarajan et al., 2006), crayfish (Cambaroides similis) (Yoon et al., 2006), cuttlefish (Sepia esculenta) (Yoon & Kim, 2010), and white clam (Meretrix lusoria) (Yoon et al., 2012). The apparent primer revealed significant differences in parties and groups, resulting from variations in DNA polymorphisms among parties and groups (Archak et al., 2003; Diaz-Jaimes & Uribe-Alcocer, 2003; Wang & Li, 2004; Wasko et al., 2004; Nagarajan et al., 2006; Yoon et al., 2006; Yoon & Kim, 2010; Yoon et al., 2012; Yoon, 2019b).
As stated before, the capacity of PCR analysis to ascertain pinpointing markers for the recognition of two blue crab groups has been validated. Basically, the grouping of crab species is founded on morphological characteristic in claw type, claw scale, form style, figure size, physique color, carapace style, and carapace scale. It is expected by Yue & Orban (2005) that the application of this method facilitates studies that require high-throughput DNA isolation for PCR amplification, such as genotyping by microsatellites for mapping and genetic diversity studies, as well as mutant screening in zebrafish.