INTRODUCTION
Olive flounder (Paralichythys olivaceus) is one of the most important fish species and constitutes more than 50% of total fish community biomass, therefore receive a lot of attention of aquaculture and fisheries in Korea. In most oviparous fish including olive flounder, larval survival is dependent upon timely development of organs for feeding. Eyesight is probably the most important sense in flounder larvae to search prey of the many developmental changes occurring the early larval period. If delaying the introduction of food causing by immature eye development, a fish larva will be subject to starvation and then eventually lead to its death. For natural populations of the olive flounder, pelagic larvae migrate to shallow water and settle on the sea-bed, after which the body changes from a symmetrical to an asymmetrical form, which includes the relocation of one eye and pigmentation of one side (Miwa & Inui, 1987; Miwa et al., 1988). Thus, extensive research has been conducted on flatfish metamorphosis with regard to the study of dramatic changes in morphology. Despite these importance, little molecular information was known with regard to the molecular mechanism of the early part of eye development. The screening and identification of expressed genes in the eye will provide useful insight into the molecular regulation mechanism of eye development in olive flounder. Furthermore, knowledge of expression patterns of eye formation-related genes can provide important clues on the functional interactions of genes within the eye.
Eye development of olive flounder is derived from the surface ectoderm, but the retina and the epithelial layers of the iris and ciliary body are from the anterior neural plate. Therefore, well-timed action of eye formation-related gene expression is important for correct development of the various eye component. Genetic study of eye development about complex process was established in zebra fish, mouse and human (Easter & Nicola, 1996; Martinez & Bolker, 2003). Histological investigations of many species have revealed the presence of a differentiated retina containing photoreceptors and neural connections to the optic tectum by the time of feeding (Gibb et al., 1995; Kim et al., 2004). However, behavioral estimates of visual acuity are lower than those gained by anatomical assessment of photoreceptor density in larval fish (Shand et al., 1999). The ability of larval fish to prey capture using eyesight is dependent on the development of the optical elements of the eye and the synaptic connections between the neurons of the retina and their connections in visual brain centers.
Crystallins are the major water-soluble structural proteins of eye lens and serve to transparency and refractive power (Wistow, 1993). Although, three major families of crystallins (alpha, beta, and gamma) are expressed in all mammalian lenses, beta and gamma-crystallins were classed a single superfamily as evolutionarily and structurally aspect while the alpha-crystallins described another group. The alpha-crystallins serve to functional small heat shock proteins in numerous tissues and beta and gamma-crystallins are structurally related to microbial stress proteins (Ray et al., 1997; Head et al., 1991) and involved various metabolic and regulatory functions (Sax & Piatigorsky, 1994; Wistow & Piatigorsky, 1988).
Through the search of an olive flounder DNA database of expressed sequence tags (EST), we found a partial sequence that was similar to crystallin beta A1 and gamma S, but the temporal expression of these gene is still not known during developmental stage in olive flounder. Therefore we demonstrated that eye development involved gene expression for understand eye formation during developmental period.
MATERIALS AND METHODS
All experimental fish were raised at Genetics and Breeding Research Center, National Fisheries Research and Development Institute (NFRDI) and maintained in 10 tons flow through tank at 20±1°C under a natural photoperiod. Different stages of embryo (~0.92mm), larval (~2.49mm) and juvenile (~3.5mm) fish kept at 20°C in the tank. The samples of 10 randomly selected fish were collected and frozen in liquid nitrogen until isolation of total RNA. Pooled eye tissues were ground with a mortar/pestle and then homogenized with a hand-held tissue tearor using Trizol reagent (Invitrogen, Carlsbad, CA, USA).
Eggs and lavae were examined as previously described, fixed at room temperature in 2.5% glutaraldehyde (Poly-sciences, Inc., Warrington, PA) in 0.1 M sodium cacodylate-HCl buffer, pH 7.3, for 10 min, and post fixed in 1% OsO4 (Sigma-Aldrich, CA, USA) in the same buffer, for 20 min with 1% uranyl acetate for 1 h and ethanol dehydration. The samples were examined under a microscope imaging systems at ×200, ×300 and ×400 magnification of development were determined.
Bioinformatic analysis was conducted to determine gene identities using Gene Master software (Ensoltek, Beaverton, USA). ESTs were assembled in clusters of contiguous sequences (conting) using ICA tools program (parsons, 1995). Gene annotation procedures and homology searches of the sequenced ESTs have been locally done by BLASTX for amino acid similarity comparisons. Matches with the Expect value (E) less than 1.0 × e-4 were considered to be significant. All ESTs that were not identified as or thologs of known genes were designated as unknown EST clones.
Total RNA was extracted using the Trizol Reagent (Invitrogen, Carlsbad, CA, USA) according to the manufacturer's protocol. DNase-I (Sigma-Aldrich, CA, USA) was treated for removing genomic DNA contamination from RNA after 30 min at 37°C. RNA concentration was measured spectrophotometrically (Gene-Quant, Pharmacia Biotech), checked by gel electrophoresis (1% agarose gel) and stored at –80°C until further use. RNA (100 ng) from each sample was transcribed to cDNA by First Strand cDNA synthesis kit (Roche Ltd., SWISS). The amplification was performed with AmpliTag Gold DNA Polymerase (Applied Biosystems., CA, USA) in My cycler Thermal Cycler (Bio-Rad Laboratories Inc., Hercules, CA, USA) using the following parameters: denaturation at 95°C for 10 min and 35 cycles of reactions of denaturation at 98°C for 10 s, annealing at 58°C for 30 s, and elongation at 72°C for 45 s. An aliquot of each PCR product was subjected to 1.5% (w/v) agarose gel electrophoresis and visualized by staining with ethidium bromide. The 5′ forward and 3′ reversecomplement PCR primers for amplification of each gene were as follows: crystallin beta A1 (5'-CGT CAT GGT GGC GAG TAC AA-3' and 5'-AAG AGG TGA TGG AGG TAA AGA-3'), crystallin gamma S (5'-AAG TTT CGT TGG AGG GAG GT-3' and 5'-GTA AAG CGC CTG AAG GAC AG-3'), β-Actin (5'-TGATG AAGCCCA GAGC AAGA-3' and 5'-CTCCATGTCA TCCCAGTTGG-3'). Relative amount of each messenger RNA was quantified by dividing by density of housekeeping gene.
To evaluate crystallin beta A1 and crystallin gamma S mRNA levels, these primers were specifically designed to detect and quantify cDNA sequences without detecting genomic DNA. The Fast-Start DNA Master SYBR Green I (Roche Ltd., SWISS) was used as fluorescent reporter dye and conjugated to 5′ ends of probes to detect amplification products in 7500 Fast Real Time PCR System (Applied Biosystems Inc. Carlsbad, CA, USA) using the following cycling conditions: denaturation at 95°C for 10 min and 43 cycles of reactions of denaturation at 95°C for 10 s, annealing at 59°C for 30 s, and elongation at 72°C for 45 s. Each sample was tested in triplicate to ensure statistical significance. The relative quantification of crystallin beta A1 and crystallin gamma S gene expression were performed using the comparative Ct method. The Ct value is defined as the point where a statistically significant increase in the fluorescence has occurred. The number of PCR cycles (Ct) required for the FAM intensities to exceed a threshold just above background was calculated for the test and reference reactions. In all experiments, β-Actin was used as the endogenous control. Results were analyzed in a relative quantitation study with the vehicle treated.
Data were analyzed using Sigma plot for Windows (Jandel Scientific, San Rafael, CA, USA). For unpaired matched comparative analysis of multiple groups, an analysis of variance (ANOVA) was performed. Data that did not meet normality assumptions were subjected to Kruskal-Wallis ANOVA on ranks, and then pairwise comparisons were made using the Student-Newman-Keuls (SNK) method.
RESULTS
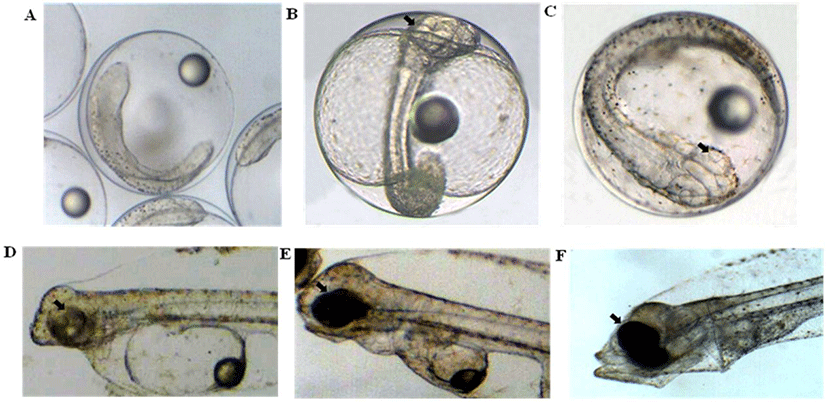
The first morphological changes leading to the formation of an ocular in olive flounder embryos are apparent as early as 1 days post-fertilization (Fig. 1A). At this stage, oculars are doing not yet allow a distinction between the prospective eyes. However, in transmission microscope the surface embryo overlying the evaginating retinal cup can be seen to form an eyes sac (Fig. 1B). The lens and retina become distinguishable in microscopy images of the developing embryos. At this stage, the prospective lens forms a cluster of morphologically undifferentiated cells that fills large parts of the lumen of the retinal cup anlage. Some of the cells in the prospective lens already show mitotic activity at this stage. (Fig. 1C). Between 1, 3 and 5 dah (Fig. 1D, E, F) period shows that the lens grows through the addition of secondary lens cells.

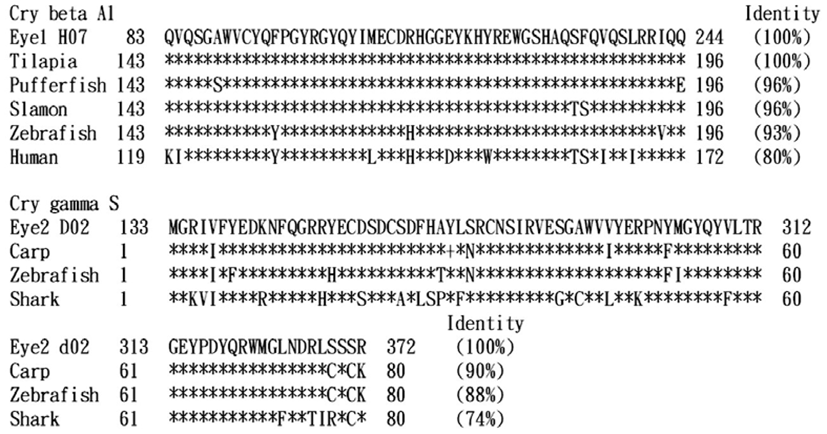
In previous study, we constructed a cDNA library using eye samples of olive flounder and screened 270 clones and several ESTs homologous with eye development involved genes. Especially, the clones homology were most abundant with crystallins (Lee et al., 2009; Lee et al., 2010). One EST had significant sequence similarity to crystallin beta A1, which is an ocularspecific molecule, the alignment showed that putative sequence shares amino acid sequence similarities with tilapia (accession no. XP003458660.1, 100% identity), pufferfish (accession no. XP003968427.1, 96% identity), salmon (accession no. NP001134082.1, 96% identity), zebrafish (accession no. NP001002410.1, 93% identity) and human (accession no. AAC50971.1, 80% identity). High similarity of another EST with crystallin gamma S showed that putative sequence is identical to carp (accession no. P10112.3, 90% identity), zebrafish (accession no. NP001013294.1, 88% identity), shark (accession no. P48649.2, 74% identity), respectively (Fig. 2).

To examine the temporal expression pattern of crystallin mRNA levels in the stage of eye formation, we analyzed the mRNA expression using RT-PCR and real-time PCR. The single band corresponding to the predicted size of crystallin beta A1 and gamma S mRNA, was highly enriched day post fertilization period (Fig. 3A). The mRNA level of crystallin beta A1 reached a certain level prior to fertilization and more increased from 1.2 dfp, increased mRNA level was significantly upregulated 1.5 dpf and then continuously maintained afterward which was delayed than the crystallin gamma S maximal induction time. The mRNA expression of crystallin gamma S was not all detectable before fertilization. The transcript level of crystallin gamma S was increased for the first time from 0.6 dpf and reached at a maximum level at 1.2 dpf and transiently elevated at 5 dpf (Fig. 3A and B).

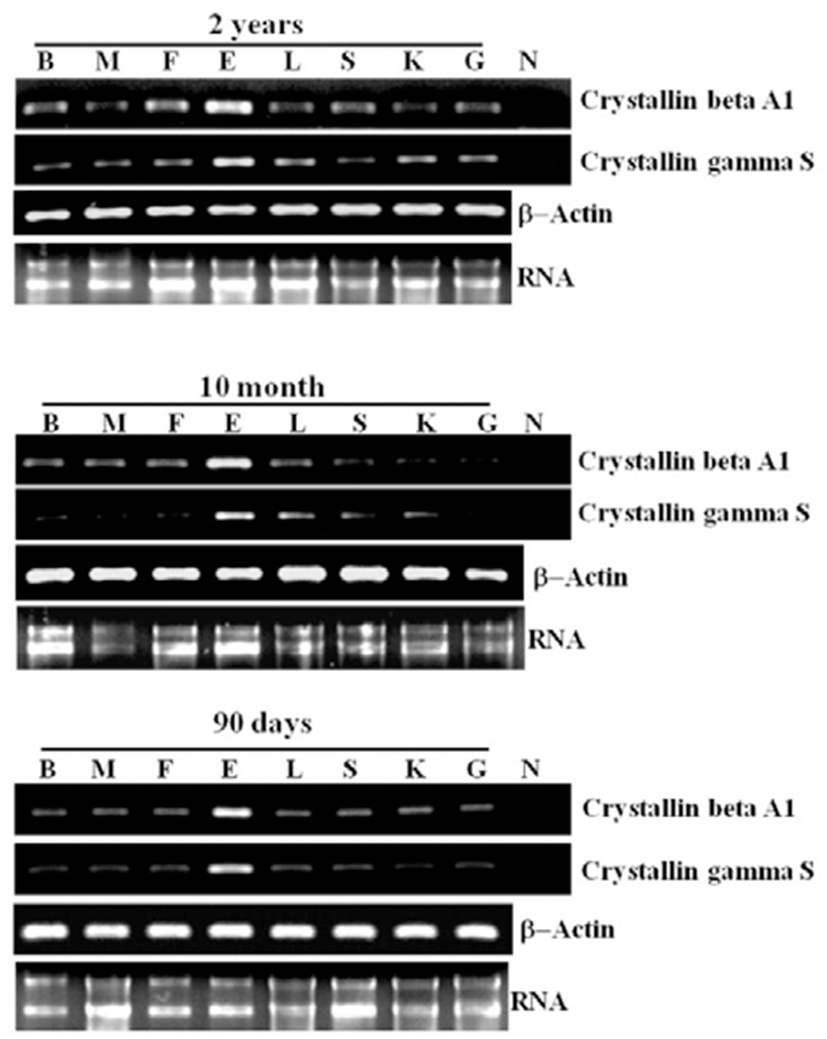
For analyzing the stage and tissue-specific expression of crystallin beta A1 and crystallin gamma S in olive flounder, we were sampled various tissue from different development stage (90 days, 10 month and 2 years olive flounder). As shown in Fig. 4, the expression of crystallin beta A1 and gamma S were obviously strong in the eye than other tissue at all tested developing stage, although were ubiquitiously expressed with weak level in all tested organ except kidney.

DISCUSSIONS
In our study, morphological change of ocular formation through microscopic observation demonstrated that eye formation finished immediately after hatching. The expression analysis of crystallin beta A1 was already increased before fertilization and more increased 1.5 days post-fertilization and maintained afterward. Also, crystallin gamma S shows a transiently increase mRNA level was detectable until 1.2 days post-fertilization and again increased in expression at 5 days after hatch. Therefore, both beta A1 and gamma S crystallin are expressed in the differentiated lens fiber cell, although each gene shows slightly difference during developmental stage. Previous study reported that large amount of crystallin expression during eye formation has been described for other species (Huizinga et al., 1989; Philipson, 1969) which is very similar to our observation. The other two members of the group of acidic betacrystallins, the beta A2 and beta A4-crystallin genes, are likely to be early genes as in vitro translation studies of calf lens RNA showed that these genes are only expressed during fetal life (Berbers et al., 1982). Observation of retinal formation correspond with the time of expression of the crystallin beta A1 and gamma S gene in the developmental stage, these result suggesting that beta A1 and gamma S play a crucial role in the remodeling of the retina during development.
Crystallins are vital for the development and maintenance of lens transparency and protect against protein unfolding and aggregation that lead to lens opacity (Horwitz et al., 1992; Parthasarathy et al., 1997). Crystallin beta A1 and gamma S expression were continuously detected in the eye during maturation and aging olive flounder. Therefore, presence of crystallins at all tested developmental period suggested that crystallin acts as a molecular chaperone to prevent protein aggregation during maturation and aging in the eye.
In conclusion, the expression profile and eye-specific expression of crystallin beta A1 and gamma S in the developmental stage may help to understand the initial growth and lifetime in the eye of olive flounder. Also, the development of the eye formation is considered olive flounder initial feeding of zooplankton feeding on early survival and give it directly connected to the affected. Further functional studies on these genes will provide more information on molecular regulatory mechanism of eye development in olive flounder.

