INTRODUCTION
Asian white clams (Meretrix lusoria) is commercially important bivalves, belonging to family Veneridae, widely distributed on the coast of the Yellow Sea, the southern sea and Jeju island in the Korean Peninsula and the several sea areas in China under the natural ecosystem (Min et al., 2004). Meretrix is widely distributed in the sandy tidal flat, the intertidal zone and 20-meter depth of seawater areas. Generally, Meretrix petechialis can be easily distinguished from M. lusoria by morphology, with the posterior dorsal margin of M. lusoria being straight, while that of M. petechialis is quite swollen, and the apex position of M. lusoria is skewed to the anterior side relative to that of M. petechialis (Yamakawa & Imai, 2012). But, juveniles of M. lusoria and M. petechialis have very similar morphologies and shell colors, making species identification difficult at the juvenile stage. Currently, DNA-based techniques for identifying interspecific variation have been established and applied to some bivalve species, including closely related species belonging to the same Genus. Studies on molecular phylogeny of Veneridae were reported genetic relationship of Veneridae five species (Jung et al., 2004), were announced using mitochondrial 16S rRNA gene or cytochrome oxidase sequencing (Chen et al., 2009). But, no studies have tested for the identification of M. lusoria and M. petechialis in some Korean localities.
In the present study, to elucidate characteristics of individuals and populations by identifying the genetic distances and geographical variations among three white clam (Meretrix lusoria) populations collected from Gunsan, Shinan and Yeonggwang, we performed a clustering analysis by using PCR method and Systat pc-package program.
MATERIALS AND METHODS
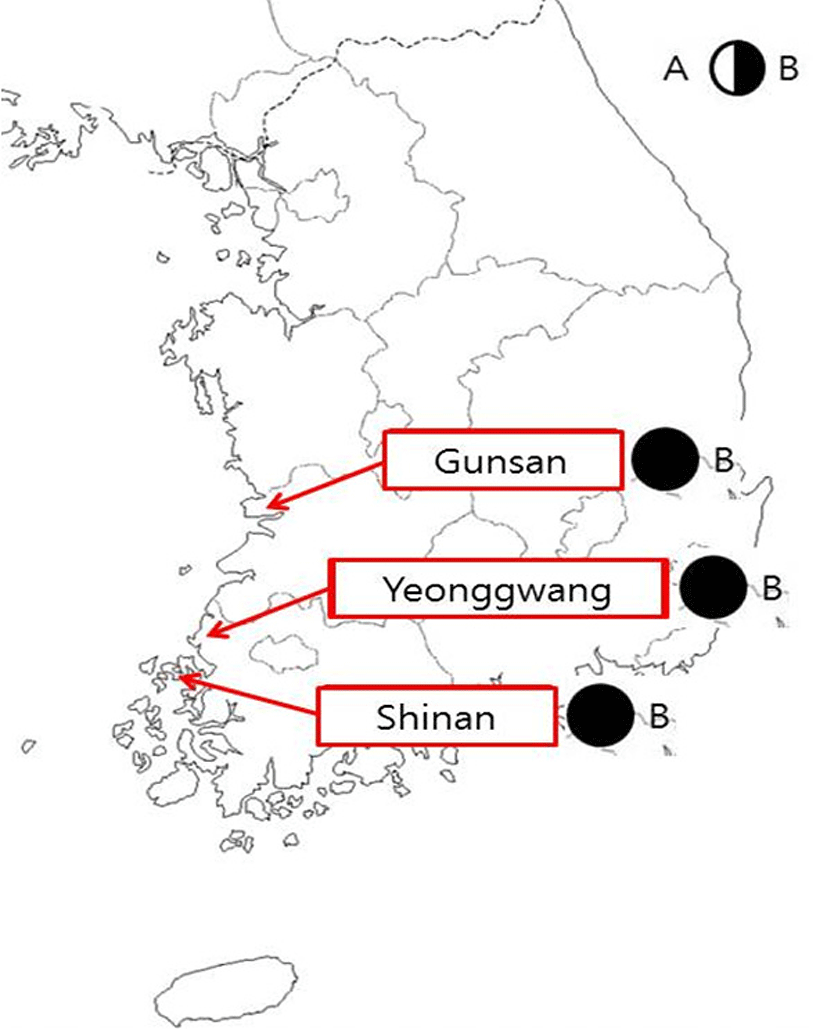
The twenty-one individuals of Meretrix lusoria were secured from Gunsan, Shinan and Yeonggwang on the coast of the Yellow Sea and the southern sea in the Korean Peninsula, respectively (Fig. 1). Muscle tissues was collected in sterile tubes and stored at –40°C until needed. DNA extraction should be carried out according to the separation and extraction methods (Yoon and Kim, 2004). The precipitates obtained were then centrifuged and resuspended in lysis buffer II (10 mM Tris-HCl, pH 8.0; 10 mM EDTA; 100 mM NaCl; 0.5% SDS), and 15 μL of proteinase K solution (10 mg/mL) was added. After incubation, we added 300 μL of 3 M NaCl, and gently pipetted for a few minutes. 600 μL of chloroform was then added to the mixture and inverted (no phenol). Ice-cold 70% ethanol was added, and then the samples were centrifuged at 19,621 g for 5 minutes to extract the DNA from the lysates.

Muscle was collected in sterile tubes, washed with PBS (155 mM NH4Cl, 10 mM KHCO3 1 mM EDTA) was added to the samples. Homogenize the muscle tissue and centrifuge at 740 g for 5 min. Collect the supernatant and discard the pellet and centrifuge again at 740 g for 5 min. Collect the supernatant, discard the pellet and centrifuge at 9,000 g for 10 min. Discard the supernatant and gently resuspend the pellet containing mitochondria. Centrifuge mitochondrial suspension at 10,000 g for 10 min. Remove the supernatant and gently resuspend the crude mitochondrial pellet. Centrifuge mitochondrial suspension again 10,000 g for 10 min to remove any microsomal contamination. Get rid of the supernatant and resuspend the crude mitochondrial pellet. The crude mitochondrial pellet should be carried out according to the separation and extraction methods (Wieckowski et al. 2009). Mitochondrial DNA of crude mitochondrial pellet was extracted using a DNA blood and tissue kit (Qiagen GmbH, Duesseldorf, Germany).
Mitochondrial DNA analysis was performed on the muscle extract of 30 individuals using specific primer. 720 bp fragment of the mitochondrial cytochrome c oxidase subunit I (COI) was amplified by PCR using Thermal cyclers (MJ Research, Inc., Watertown, USA; Perkin Elmer Cetus, Norwalk, USA). PCR reaction was performed in 25 μL samples, which contained 2 μL of template DNA, 20 μL of premix (Bioneer Corp., Daejeon, Korea), and 1 μL each of 25 pM primers (Forward : 5'-GGT CAA CAA ATC ATA AAG ATA TTG G-3' and Reverse : 5'-TAA ACT TCA GGG TGA CCA AAA AAT CA-3'; Folmer et al., 1994). This premix was followed a pre-denaturation at 94°C for 2 min. The thermal cycler programmed for 30 cycles of denaturation at 94°C for 15 sec, annealing at 50°C for 15 sec, extension at 72°C for 30 sec, post-extension at 72°C for 7 min.
RFLP surveys of the COI region indicated that Hinc II (Takara, Inc., Shiga, Japan) digestion produced heterogeneous distributions of restriction types among samples. RFLP analysis was performed in 20 μL volume containing 2 μL 10XM buffer (Takara, Inc., Shiga, Japan), 1 μL of Hinc II and 6 μL of PCR product at 37°C for 2 h. A 20 μL portion of the reactant was generated electrophoresis on 1% agarose (VentechBio, Eumsung, Korea) gel containing TBE (90 mM Tris, pH 8.5; 90 mM borate; 2.5 mM EDTA). Gels were stained with ethidium bromide, illuminated by ultraviolet rays, and photographed.
Seven oligonucleotides primers BION-01 (5'-CAGGC CCTTC-3'), BION-08 (5'-TCCGCTCTGG-3'), BION-13 (5'-GTTTCGCTCC-3'), BION-17 (5'-TGCTCTGCCC-3'), BION-47 (5'-CAGCACCCAC-3'), BION-49 (5'-CGGTGG CGAA-3') BION-69 (5'-GCATCCACCA-3') were shown to generate average loci per lane and specific loci which could be clearly scored. Thus, the authors used the primers to study the genetic variations and DNA polymorphisms of the Meretrix lusoria. PCR was performed using two Programmable DNA Thermal Cyclers (MJ Research, Inc., Watertown, USA; Perkin Elmer Cetus, Norwalk, USA). PCR conditions was preheating at 94°C for 5 min followed by 45 cycles of denaturation at 94°C for 1 min, annealing at 36°C for 1 min, and extension at 72°C for 1 min, and then a post-cycle extension at 72°C for 5 min, using the fastest available transition between each temperature. Optimal DNA concentrations for amplification were determined by testing several dilutions, one of which was taken as the standard for every subsequent amplification. Amplification products were generated via electrophoresis on 1.4% agarose (VentechBio, Eumsung, Korea) gel containing TBE (90 mM Tris, pH 8.5; 90 mM borate; 2.5 mM EDTA). The 100 bp DNA Ladder (Bioneer Corp., Daejeon, Korea) was used as a DNA molecular weight marker. Bands were detected by ethidium bromide staining. The stained agarose gels were illuminated by ultraviolet rays, and photographed using a photoman direct copy system (PECA Products, Beloit, WI, USA).
The degree of variability was calculated by use of the Dice coefficient (F), which is given by the formula: F = 2 nab / (na+nb), where nab is the number of bands shared between the samples a and b, na is the total number of bands for sample a and nb is the total number of bands for sample b (Jeffreys & Morton, 1987; Yoke-Kqueen & Radu, 2006). Euclidean genetic distances within- and between-populations were also calculated using the hierarchical dendrogram program Systat ver.10 (SPSS Inc., Chicago, IL, USA).
RESULTS AND DISCUSSION
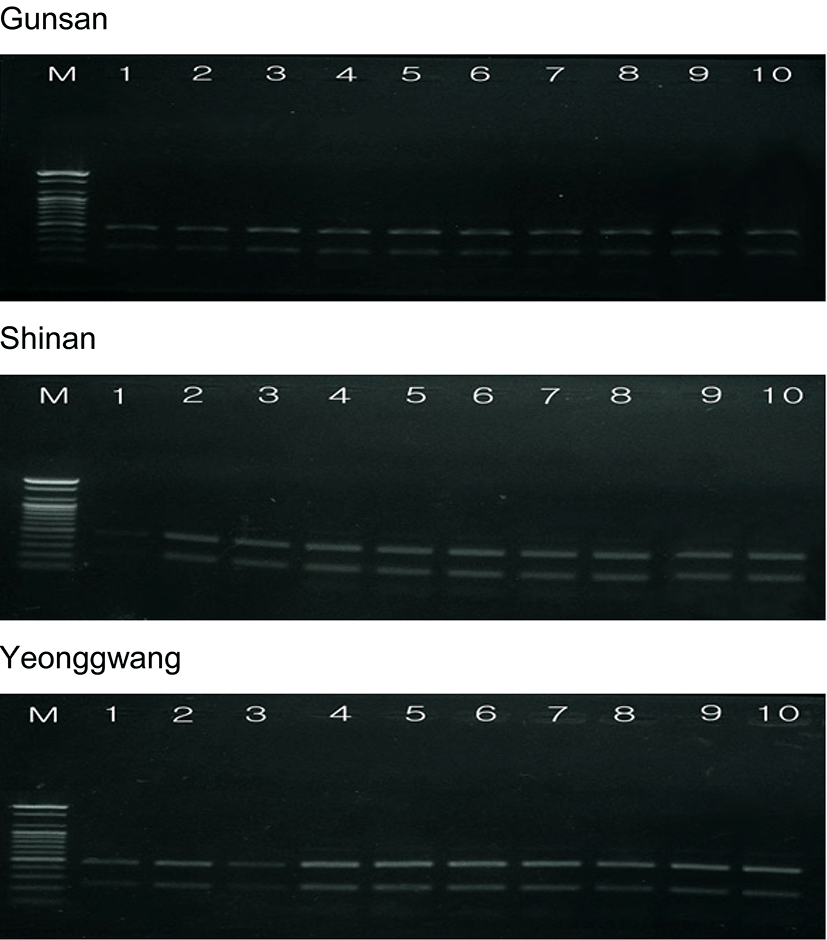
Amplification of a single COI fragment (720 bp) was imagined, and no apparent size differences were observed in amplified fragments between Meretrix lusoria and M. petechialis individuals. Hinc II digestion of PCR products discovered two unique restriction patterns designated type A (418 bp and 306 bp fragments) and type B (479 and 247 bp), that were completely diagnostic to distinguish M. lusoria from M. petechialis individuals (Yamakawa & Imai, 2012). But no one of the three populations sampled in Korea contained M. petechialis restriction type A phenotype (Table 1 and Fig. 2). In general, the adult shell shape of M. lusoria is a curved triangle, while that of M. petechialis is elliptical. The caudal dorsal edge of M. lusoria is straight, whereas that of M. petechialis is puffy, and the top position of M. lusoria is slanted to the front side relative to that of M. petechialis (Min et al., 2004). Identifying Meretrix lusoria based only on morphological shell shape can be difficult while judgments based on a combination of morphology and genetic information is generally more trustworthy.
| Location | No. |
Hinc II restriction type |
|
|---|---|---|---|
| A | B | ||
| GS | 10 | 0 | 10 |
| SA | 10 | 0 | 10 |
| YG | 10 | 0 | 10 |

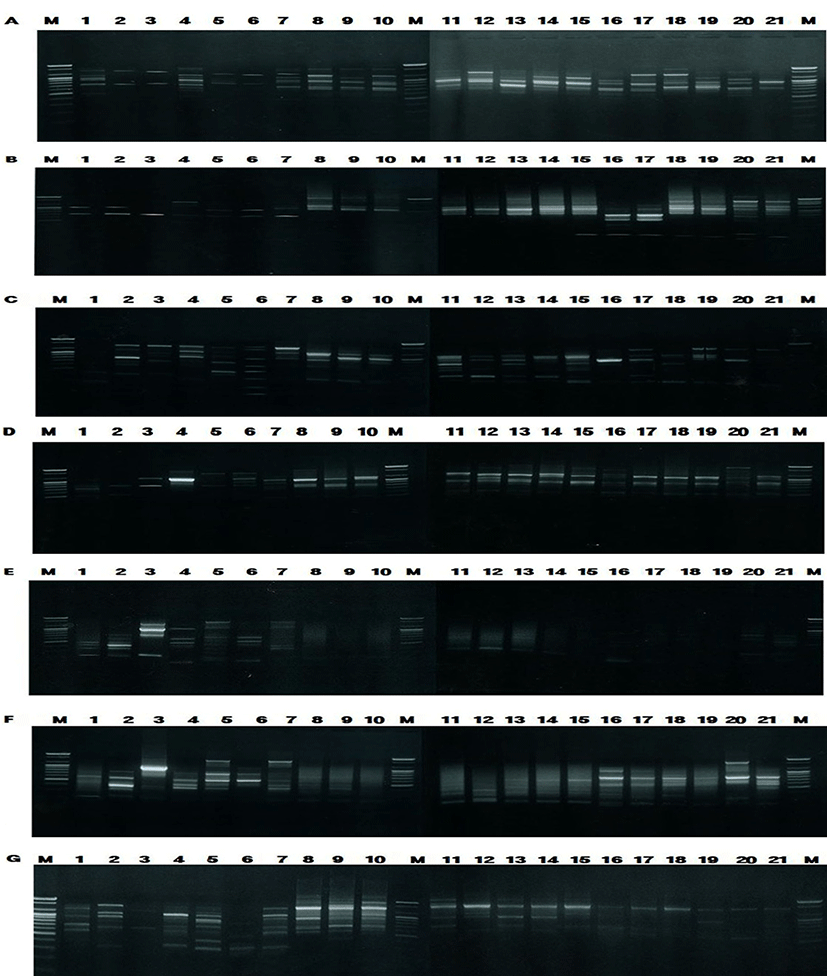
The amplified products were separated by agarose gel electrophoresis with oligonucleotides primers, and stained with ethidium bromide. Similarity matrix including band-sharing values (BS) and genetic differences was calculated using Nei and Li's index of the similarity of venerid clam individuals from Gunsan, Shinan and Yeonggwang of the Korean Peninsula, respectively, as illustrated in Table 2. The seven oligonucleotides primers BION-01, BION-08, BION-13, BION-17, BION-47, BION-49 and BION-69 generated the total number of loci, average number of loci per lane and specific loci in Gunsan, Shinan and Yeonggwang population, as summarized in Table 3. Here, the complexity of the banding patterns varied dramatically between the primers from the three populations. The size of the DNA fragments also varied excitedly, from 200 to 1,600 bp, as shown in Fig. 3. The primer BION-01 generated the most loci (a total of 58), with an average of 8.29 in the Shinan population, as revealed in Table 3. The oligonucleotides primer BION-08 produced the least loci (a total of 17), with an average of 2.43 in the Gunsan population, in comparison to the other primers used. In this study, 7 primers generated 34.7 specific loci in the Gunsan population, 42.6 in the Shinan population and 40.1 in the Yeonggwang population. The specific loci generated by oligonucleotides primers demonstrated inter-individual-specific characteristics, thus revealing DNA polymorphisms. Many researchers considered the sizes of DNA fragments in the PCR profiles of five species of Eastern Pacific abalone (genus Haliotis) (Muchmore et al., 1998), the brittle star (Amphiura filiformis) (McCormack et al., 2000), oyster (Kim et al., 2004), Korean catfish (Yoon and Kim, 2004), Venus clam (Park & Yoon, 2008) and cockle (Kang & Yoon, 2013).

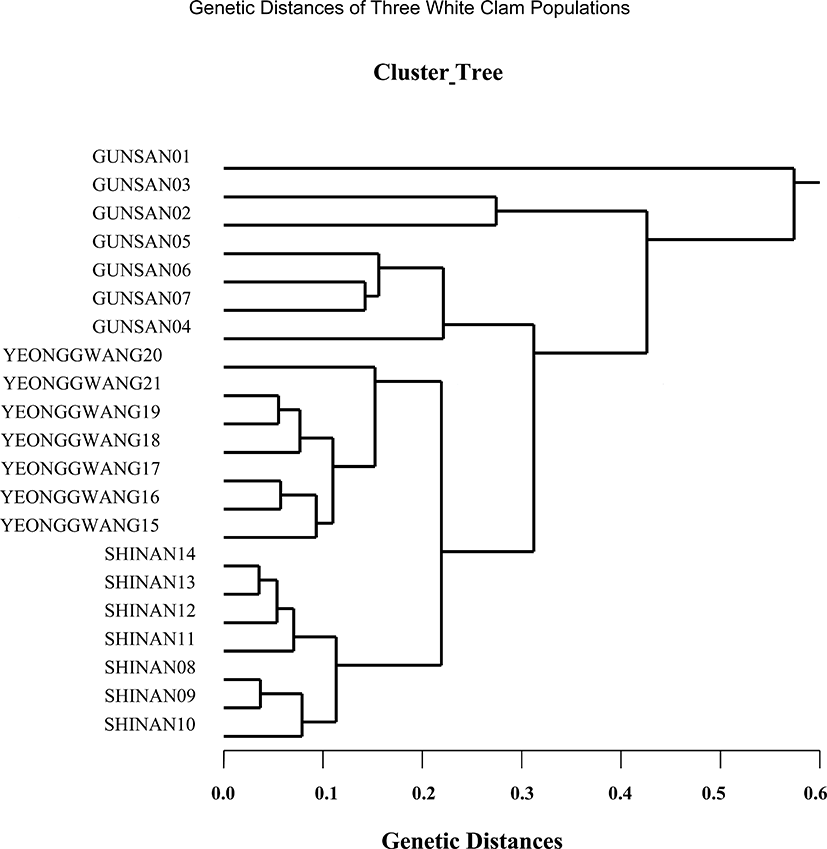
The seven oligonucleotides primers BION-01, BION-08, BION-13, BION-17, BION-47, BION-49 and BION-69 were used to produce unique shared loci to each population and shared loci by the three populations, as summarized in Table 4. The oligonucleotides primer BION-13 generated 42 unique loci to each population, approximately 200 bp, 400 bp, 800 bp, 900 bp, 1,000 bp and 1,200 bp respectively, in the Shinan population. Remarkably, the primer BION-13 detected 42 shared loci by the three populations, major and/or minor fragments of sizes 200 bp and 400 bp, respectively, which were identical in all samples. With reference to average bandsharing value (BS) results, individuals from Shinan population (0.811) displayed higher bandsharing values than did individuals from Gunsan population (0.626), as summarized in Table 5. In the present study, the dendrogram gained by the seven oligonucleotides primers highlight three genetic clusters: cluster 1 (GUNSAN 01 ~ GUNSAN 07), cluster 2 (SHINAN 08 ~ SHINAN 14) and cluster 3 (YEONGGWANG 15 ~ YEONGGWANG 21), as shown in Fig. 4. Among the seven white clam individuals the shortest genetic distance that displayed significant molecular differences was between individuals 13 and 14 from the Shinan population (genetic distance = 0.036), while the longest genetic distance among the twenty-one Meretrix lusoria individuals that displayed significant molecular differences was between individuals GUNSAN no. 01 and SHINAN no. 14 (genetic distance = 0.574). Comparatively, individuals of SHINAN population were fairly closely related to that of YEONGGWANG population. As above mentioned, a dendrogram disclosed close relationships between individual identities within three geographical bivalve populations (McCormack et al., 2000; Kang & Yoon, 2013). In bivalves, cluster analysis of the pairwise population matrix, created from genetic data, exhibited that geographically close populations have a tendency to cluster together in the blacklip abalone (Huang et al., 2000).
| Populations | GS | SA | YG |
|---|---|---|---|
| GS | 0.626±0.064b | 0.491±0.056a | 0.482±0.039a |
| SA | - | 0.811±0.064c | 0.653±0.072b |
| YG | - | - | 0.729±0.064bc |

Three Meretrix lusoria populations can be evidently distinguished, by PCR-founded approach. The potential of oligonucleotides amplified polymorphic and/or specific DNAs to identify diagnostic markers, species and population identification in shellfish (Callejas & Ochando, 1998; McCormack et al., 2000; Park et al., 2008; Kang & Yoon, 2013) has also been well recognized. PCR fragments discovered in this study may be worthwhile as a DNA marker the three geographical populations to discriminate. In general, the population classification of venerid clam is constructed on morphological variations in shell body weight, shell color, shell height, shell length, shell type and feet length. It is presumed that differences in such characters reflect diverse origins or genetic identity (Chenyambuga et al., 2004). If systematic research of Korean Veneridae is in additive progress, these data could be used as basic data.
