INTRODUCTION
Red-spotted grouper (Epinephelus akaara) that belong to subfamily Epinephelinae of the family Serranidae is a tropical marine species in Southeast Asia (Randall, 1987). E. akaara has been heavily targeted in fisheries because of high market prices (Randall, 1987; Morris et al., 2000). Since 2003, red-spotted grouper has been listed as an endangered species on the International Union for the Conservation of Nature (IUCN) red list of threatened species (Cornish, 2003). In the natural habitat of E. akaara, rainy season (monsoon) brings heavy precipitation and subsequent freshwater influx into coastal seawater, being leading to dramatic salinity decrease (below 20 ppt) (Lü et al., 2015). Juvenile E. akaara occur in relatively shallow coastal water in comparison to large adult individuals (Cornish, 2003), and thus juveniles are likely to encounter salinity changes as a result of precipitation. While interest in developing E. akaara aquaculture has been increasing (Cho et al., 2015; Park et al., 2016), there is paucity of published information on environmental physiology of the species such as salinity tolerance and preference.
Changes in environmental salinity as a stressor can cause physiological and morphological adjustments in osmoregulatory system of fish (Sangiao-Alvarellos et al, 2005; Arjona et al., 2007). This osmoregulation is an energy demanding process that requires mobilization of energy substrates from the body (Vargas-Chacoff et al., 2009; Shahkar et al., 2015). The mobilization is triggered by plasma cortisol and/or catecholamine levels, which lead to elevation in blood glucose levels (Mommsen et al., 1999; Moyle & Cech, 2004). Thus, plasma glucose level provides useful information about the fish’s physiological status under salinity stress (Mommsen et al., 1999; Laiz-Carrion et al., 2002). Some of soluble enzymes in blood plasma have been considered as indicators of hepatic dysfunction and damage (Asztalos et al., 1990; Datta et al., 2007). Glutamic oxalate transaminase (GOT) and glutamic pyruvate transaminase (GPT) are dominant in cardiomyocytes and hepatocytes, respectively (Bhattacharya et al., 2008). When liver and myocardiocytes are damaged or their permeability increased, GOT and GPT are released into the blood (Wang et al., 2005; Gholami-Seyedkolaei et al., 2013). Thus, blood GOT and GPT can be used to detect tissue damage in fish (Wang et al., 2005). Hematological changes including red blood cell (RBC) volume and plasma osmolality can be accompanied by environmental changes such as salinity changes depending on severity of changes and species (Moyle & Cech, 2004). Hematological change caused by salinity change is usually a physiological adaptation mechanism to overcome osmotic disturbance and reach a new homeostasis in fish (Jensen et al., 2002).
The ability to tolerate various salinity ranges differs with species (Kindle & Whitmore, 1986; Arjona et al., 2007) and also with body mass. Yet, none has determined what levels of salinity decrease and subsequent changes in physiological parameters can lead to morphological changes in tissue levels in E. akaara. To identify effects of stressors, histological examinations of fish tissues have proven to be a reliable tool in controlled experiments and field studies (Teh et al., 1997; Lee et al., 2012). Especially, examination of gills histology is meaningful because gills are a primary osmoregulatory organ and its morphological changes can affect gas exchange of whole animal as well as osmoregulatory capacity.
Stress and unfavorable environmental conditions can compromise normal development and growth (Akatsu et al., 1983; Arjona et al., 2009). Thus, finding optimal environmental condition including salinity is a key to establishment of sustainable aquaculture. A group of researchers reported a significantly higher survival and growth of larval brown-spotted grouper, Epinephelus tauvina, at a salinity of 25 PSU (Akatsu et al., 1983). Also, it is a widely accepted practice that when fish is transported, lowering salinity of transportation medium than salinity in grow-up tanks. Aquaculture farms in the South China are located in the coastal area, which encounter sudden salinity drops (below 20 ppt) as a result of rain (Lü et al., 2015). It is critical to know physiological responses of E. akaara to salinity decreases in juvenile stage. To our knowledge, it is the first study to look at plasma and histological stress responses in juvenile E. akaara exposed to salinity de-creases. The objective of the current study was to investigate acute plasma stress responses and gill histological changes in two size groups of juvenile E. akaara exposed to abrupt salinity drops (from 34 PSU to 18, 10 or 26, 18, 10 PSU, respectively) to determine salinity tolerance range(s).
MATERIALS AND METHODS
For experiment 1, E. akaara was hatched and raised at the Marine Science Research Institute, Jeju National University, Jeju, Korea at a controlled environmental condition (temperature: 23±0.5°C, salinity: 34±0.5 practical salinity unit, PSU, dissolved oxygen, DO: 8.5±0.5 mg/L, pH: 7.8±0.4) before transportation. Five-month old fish (150 days after hatch, DAH) of similar size were selected and transported from the Marine Science Research Institute to the laboratory at Pukyong National University, Busan, Korea. The transported fish were gradually acclimated at the environmental conditions (20±1°C, 34±1 PSU, DO: ≥7.4 mg/mL, pH: 7.5±0.3) for 2 weeks prior to the salinity experiment. During the 2- week acclimation period, the E. akaara were fed a commercial feed (Aquapro Flounder, Le Gouessant, France) to ad libitum twice a day. For experiment 2, E. akaara were hatched and raised at Fish Farm, Muangun, Korea at a controlled indoor environments (temperature: 25±1.5°C, salinity: 33±2 PSU, DO: 7.0±0.5 mg/L, pH: 7.4±0.5) before transportation. After four-month old E. akaara (120 DAH) were selected and transported from the farm to the laboratory at Pukyong National University. Then, the transported fish were gradually acclimated and maintained in a very similar manner as for the experiment 1 for 2 weeks before the salinity experiment.
For experiment 1, a total of 20 E. akaara of similar size (150 DAH, mean total length: 8.1±0.22 cm; body weight: 8.4±2.1 g) was selected and randomly distributed to three 120-liter rectangular glass tanks (recirculating water systems, 75 × 43 × 43 cm) with temperature controllers (OKE-6422H, OKE, Korea) and biological filtration (5 fish/tank). Then, one of the three different experimental salinities (34, 18, 10 PSU) was randomly assigned to each of three tanks. For experi-ment 2, a total of 80 E. akaara of similar size (120 DAH, mean total length: 6.2±0.6 cm; body weight: 3.3±0.6 g) were selected and randomly distributed to four tanks (20 fish/tank), and then one of the four different experimental salinities (34, 26, 18, 10 PSU) was randomly assigned to each of four tanks. Different salinities were provided by mixing filtered seawater with dechlorinated filtered tap water in advance. Temperature, dissolved oxygen, pH, and salinity were checked and adjusted daily using a portable water quality meter (HI9829, Hanna Instrumentals, Woonsocket, RI, USA) and maintained at 20±1°C, dissolved oxygen: ≥7.1 mg/L, pH: 7.80±0.2 respectively. Ammonia levels were regularly checked using NH3/NH4+ test kit (Tetra GmbH, Melle, Germany) and were maintained at undetectable levels. Both experiments were separately conducted for 72 h, because the second experiment was conducted with additional sampling time points, salinity (26 PSU), and a different size group to confirm and supplement the first experiment. Fish were fasted during the trials. Any debris and feces was siphoned out daily for additional water quality control and fresh seawater was refilled (about 10% water change/day). All experimental procedures were conducted according to the guidelines of Animal Ethics Committee Regulation, No. 554 established by Pukyong National University, Busan, Korea.
Fish were fasted for 24 h before sampling to allow evacuation of feed from the gastrointestinal tract for initial (0 h) sampling. At the each sampling time point (experiment 1: 0 h and 72 h; experiment 2: 0 h, 12 h, 24 h, 48 h, 72 h), five fish per tank were randomly captured and anesthetized using 300 mg/L 2-phenoxyethanol (C8H10O2, FW 138.2, Sigma-Aldrich, St. Louis, Mo, USA), and blood was collected from caudal vein using heparinized capillary tubes for determination of RBC count, and blood biochemical analyses (plasma glucose, GOT, GPT). Gills were sampled at 0 h and 72 h for histological examination. For the blood biochemical analyses, plasma was separated by centrifuging at 13,000 g for 15 min at 4°C and then the supernatant was stored at -70°C until use. RBC count was carried out in microscopy with hemocytometers in that cells were suspended in a premade Hayem’s solution. Plasma glucose (mg/dL), GOT (U/I), and GPT (U/I) were determined in duplicate using an automatic analyzer (FUJI DRI-CHEM NX500i, Fuji film Co., Japan), which was validated as a suitable method for fish plasma (Krome, 2014). The automatic analyzer was operated according to the manufacturer’s protocol using selected testing slides (multi-layered slides, Fujifilm Co., Japan).
Histological preparation and microscopic observation followed the method overall (Lee et al., 2012). Briefly, following anesthetization left side of whole gills were surgically removed and immediately fixed in Bouin’s solution for histopathological examination. After being washed in tap water, the fixed tissues were dehydrated in a graded series of ethanol, cleared in xylene, infiltrated with paraffin using a tissue processor (TP1020, Leica, Germany) and embedded in paraffin blocks; serial sections (5 μm thick) were prepared from each tissue using a microtome, placed on clean glass slides, dried in an incubation oven at 38˚C for 48 hours, and stained with Mayer’s hematoxylin (Sigma-Aldrich, St. Louis, MO, USA) and eosin (Eosin Y, Junsei Chemical Co., Tokyo, Japan). Histological changes were systemically examined under a microscope (BX-50, Olympus, Japan) (Teh et al., 2004).
Statistical analyses were conducted using SPSS Statistics 21 (IBM Corp., Chicago, IL). A two-way analysis of variance with interaction was used to test for significant differences among the different salinity treatments at different time points. Duncan’s Multiple Range test was used for multiple comparisons between different treatment groups at each sampling time point. Statistical significance was tested at the 0.05 probability level, and all values are presented as mean ± standard error of the mean, unless noted otherwise.
RESULTS
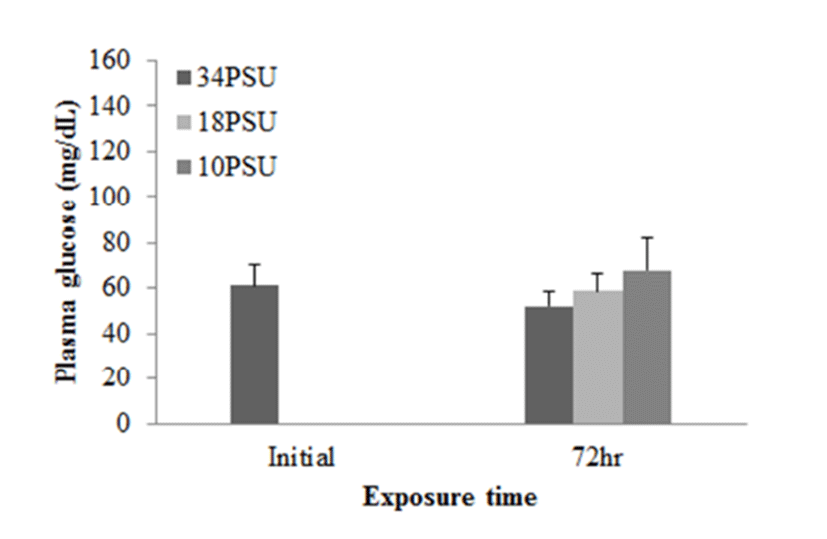
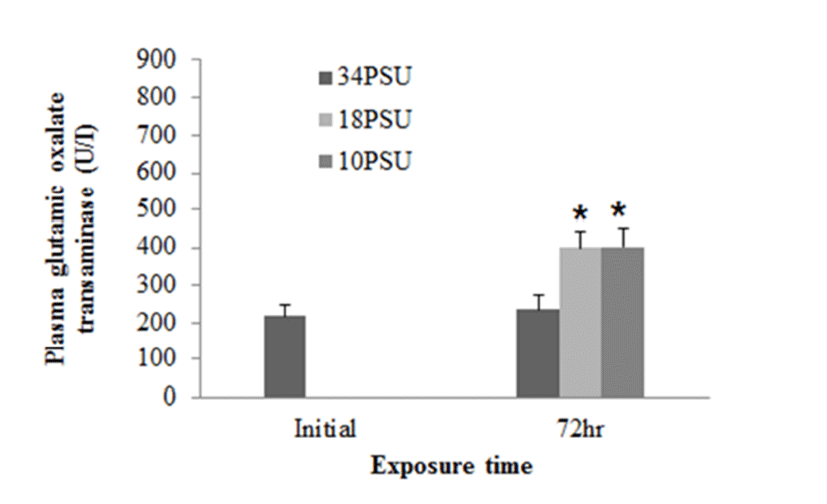
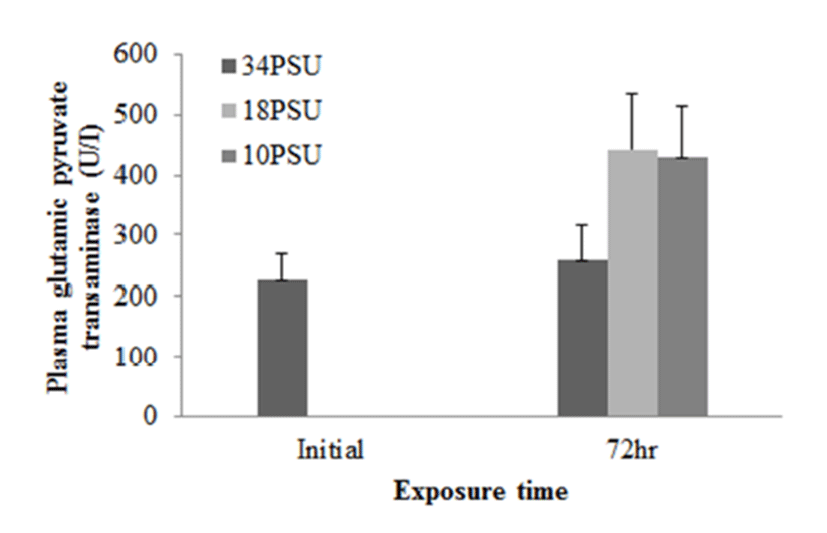
In experiment 1, E. akaara (mean TL: 8.1±0.2cm) exposed to 18 and 10 PSU for 72 h showed increased plasma glucose levels compared to the control (34 PSU), even though the increases were not significant (Fig. 1). The fish exposed to 18 and 10 PSU for 72 h showed significantly increased plasma GOT levels compared to the control (n=5) but showed similar GOT values (Fig. 2). Regarding plasma GPT levels, salinity changes did not cause any significant changes in plasma GPT levels of different groups. However, fish exhibited higher mean GPT values at 18 and 10 PSU than at the control without statistical significance (Fig. 3).
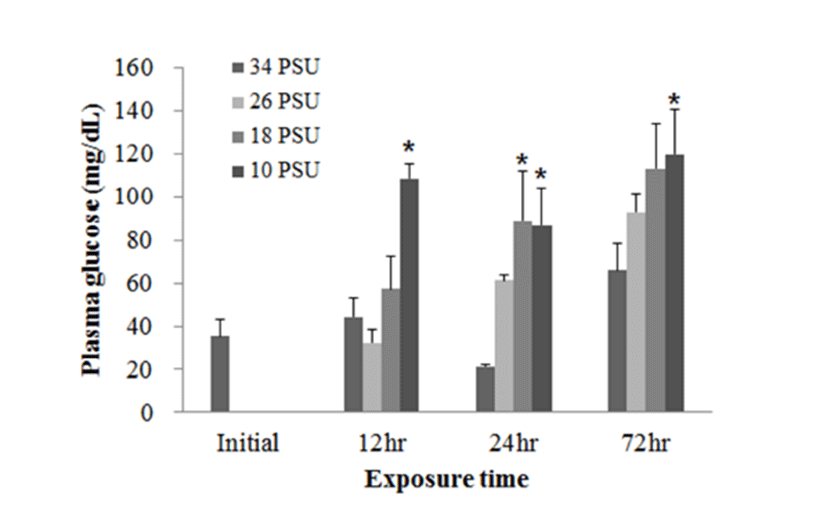
In experiment 2, plasma glucose, GOT, and GPT levels of E. akaara (mean TL: 6.2±0.6 cm) exposed to 26, 18, 10 PSU for 12, 24, 48, 72 h were determined. In regard to plasma glucose level, E. akaara exposed to 10 PSU showed significant increase from 12 h to 72 h (n=5) (Fig. 4), whereas the increases in fish exposed to 18 PSU were not significant. Glucose levels at 48 h were not presented due to limited blood volume.
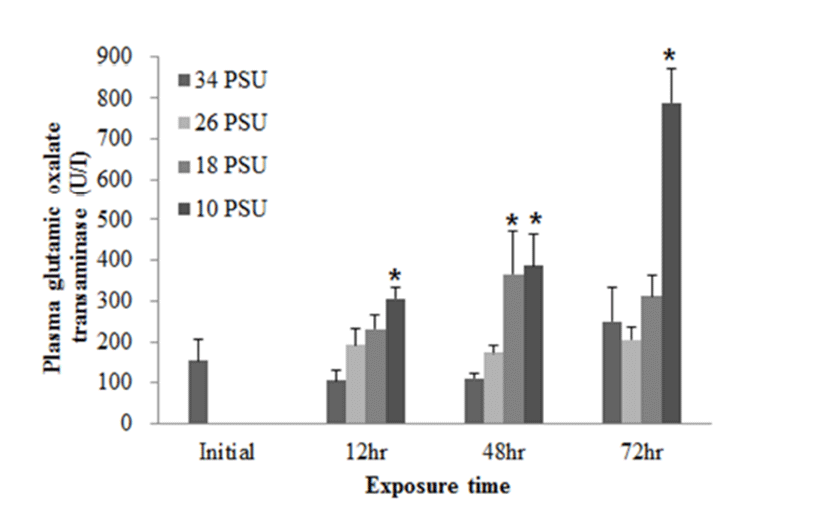
With regard to plasma GOT levels, E. akaara exposed to 26, 18, 10 PSU at 12 h post-drop showed a dose-dependent increases compared to the control, but only fish exposed to 10 PSU showed a significant increase compared to the control. E. akaara exposed to 18 or 10 PSU showed significantly increased GOT levels at 48 h post-drop. At 72 h post-drop, only fish exposed to 10 PSU exhibited a significant increase compared to the control. Data on 24 h were not presented due to limited blood volumes (Fig. 5).
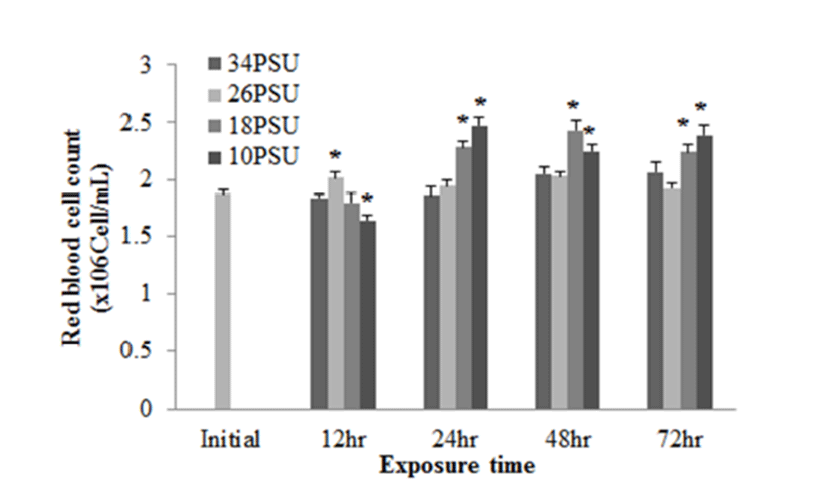
In regards to RBC count, after E. akaara exposed to 10 PSU showed a significant decrease at 12 h post-drop, fish exposed to 18 and 10 PSU exhibited significant increases from 24 to 72 h post-drop, compared to the control (Fig. 6).
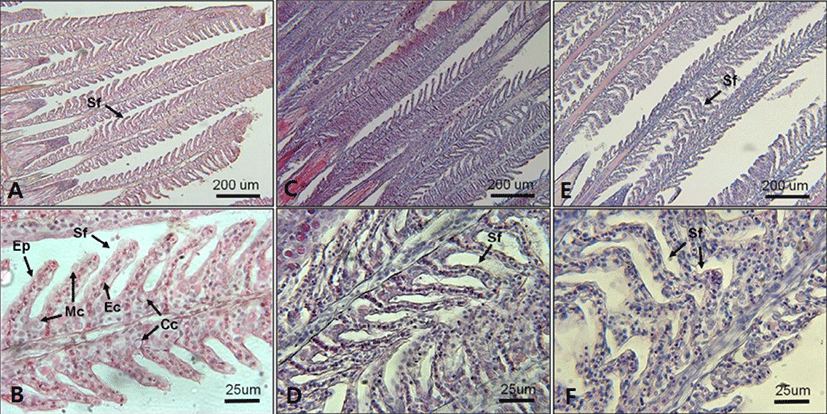
In regard to histological changes of the gills, slight proliferation of epithelium (hyperplasia) and epithelium lifting in the secondary lamellae were observed in fish exposed to 18 and 10 PSU (Figs. 7. D and F). A single layer of epithelium in the secondary lamellae for effective gas exchanges, which is supported by pillar cells, was disintegrated in some parts of fish gills exposed to 18 and 10 PSU (Figs. 7. D and F).
DISCUSSION
The two size groups of juvenile E. akaara (mean TL 8.1±0.22 cm and 6.2±0.6 cm, respectively) exposed to 18 or 10 PSU for 72 h in the current study are still in the primary adjustment phase (Laiz-Carrion et al., 2005; Sangiao- Alvarellos et al., 2005). However, E. akaara exposed to 26 PSU in experiment 2 do not seem to be affected by low salinity challenge. This conclusion is supported by the following findings. First, the fish exposed to 18 and 10 PSU exhibited the significantly increased plasma glucose, GOT, and RBC counts compared to the control (34 PSU) at 72 h post-drop (Figs. 1-6). Second, the blood stress parameters, especially plasma glucose and GOT, do not seem to reach a plateau at 72 h post-drop in experiment 2 (Figs. 4 and 5). Lastly, histopathological changes in the gills of fish exposed to 18 and 10 PSU were mild but distinct (Fig. 7). However, further studies with longer exposure period (e.g. more 14 days) and additional parameters (e.g. gill Na+K+- ATPase activity, plasma osmolality) is needed for deeper under-standing of osmoregulatory responses of E. akaara to low salinity challenges.
In response to salinity changes, fish undergo two osmoregulatory phases: first, an primary adjustment phase with alternations in osmoregulatory variables (including plasma osmolality and electrolyte concentrations), and then a secondary chronic regulatory phase, where osmotic parameters reach a new homeostasis (Laiz-Carrion et al., 2005; Sangiao- Alvarellos et al., 2005; Arjona et al., 2007). The ranges of primary adjustment phase in fish are species-dependent. In our study, RBC counts started to show changes at 12 h post-drop. Later, RBC counts in fish exposed to 18 and 10 PSU seem to reach a plateau from 24 h post-drop (Fig. 6). However, other blood parameters (plasma glucose and GOT) in experiment 2 do not seem to reach a plateau yet at 72 h post-drop (Figs. 4 and 5). Modifications in osmoregulatory parameters such as electrolyte concentrations of partially euryhaline species are often detected within 2-3 days after transfer (Laiz-Carrion et al., 2005; Sangiao- Alvarellos et al., 2005). In a salinity-challenge study on Senegalese sole (Solea senegalensis), the adjustment period in fish involved approximately 7 days and then the chronic regulatory phase at day 14 or day 17 (Arjona et al., 2007). In another study on Sparus auratus, an adjustment period lasted for the first three days of acclimation in hyper- and hypo-osmotic challenges (Sangiao-Alvarellos et al., 2005).
The increased plasma glucose level is an indicator of the secondary stress response in fish (Moyle & Cech, 2004). In experiment 1, E. akaara exposed to 34, 18, or 10 PSU did not show significant difference in plasma glucose levels between the different treatments, even though mean values were higher with lower salinity (Fig. 1). The no significant difference in glucose level between the treatments seem to be associated with individual variations and/or limited sample size (n=5). In experiment 2, our result that the significant increase in plasma glucose level of E. akaara exposed to 18 and 10 PSU compared to the control generally agree with a previous study on osmoregulatory response of Senegalese sole by (Arjona et al., 2007). Arjona et al. (2007) reported the significantly increased plasma glucose levels in the sole at a salinity drop to 5‰, but not to 15‰, from 38 ‰, in which the glucose levels were kept increased until 5-6 days post-drop compared to the control (38 ‰). Based only on glucose levels, E. akaara may be more stenohaline than Senegalese sole because of increased glucose levels in experiment 2 at 18 PSU. The increased plasma glucose levels are stimulated by catecholamines and/or cortisol (Mommsen et al., 1999). Plasma cortisol level is a primary stress response to various stressors in teleost (Mommsen et al., 1999; Moyle & Cech, 2004). Environmental salinity has been accepted as a stress that induces a primary stress response and cortisol release into blood stream (Moyle & Cech, 2004). It is speculated that the elevated plasma glucose levels observed in the current study were likely to be mediated by the plasma cortisol influx into the blood with uncertainty on role of plasma catecholamines in this context.
GOT and GPT are enzymes found in the liver, heart, skeletal muscle (Bhattacharya et al., 2008). These two enzymes in blood serum have been considered as indicators of hepatic dysfunction and damage (Wang et al., 2005; Ming et al., 2012). In healthy conditions, GPT and GOT are dominant in hepatocytes and cardiomyocytes, respectively. They are vital components in protein metabolism (Harper, 1978), and play important roles in the utilization of amino acids for oxidation and/or for gluconeogenesis (Rodwell, 1988). When liver and myocardiocytes are damaged or their permeability increased, GOT and GPT are released into the blood, leading to elevated blood transaminase activity (Wang et al., 2005; Gholami-Seyedkolaei et al., 2013). Thus, plasma GOT and GPT can be used to detect tissue damage in fish. Ming et al. (2012) reported that when freshwater bream (Megalovrama amblycephala) were under heat stress at 34°C, GOT and GPT levels were significantly elevated. In the current study, plasma GOT levels in E. akaara exposed to 18 or 10 PSU was significantly increased compared to the control during the 72 h challenge. Especially, fish exposed to 10 PSU showed increases in a time-dependent manner (Fig. 5), which suggests that E. akaara exposed to 10 PSU may have compromised hepatocyte and/or myocardiocyte function.
Mild epithelial hyperplasia and lifting observed in the secondary lamellae of E. akaara exposed to 18 and 10 PSU have been previously reported as toxin-induced stress responses in other fish species (Deng et al., 2008; Lee et al., 2012). The observed hyperplasia and lifting of the epithelium in the secondary lamellae could have interfered with the efficient gas exchange in the gills (Lee et al., 2012). However, it is speculated that, because the lesions were not severe, the fish may have compensated for the reduced efficiency by increasing the RBC volume, gill ventilation rate, cardiac output, or lamellar recruitment to meet the possibly increased demand in gas exchanges induced by salinity changes in the current study (Moyle & Cech, 2004). Also, it is possibly speculated that the increased RBC at 18 and 10 PSU (Fig. 6) could be one of the aforementioned respiratory compensation mechanisms for gill morphological modification observed in the current study (Fig. 7). At this point, we are not sure whether the histological alterations observed in the two salinities treatment at 72 h post-drop are reversal or not.
It is suggested that E. akaara exposed to sudden salinity drops to 18 or 10 PSU still undergoes the primary adjustment phase (“alarming stage”) before the fish reach a new homeostasis (“resistant stage”), based on our current results on the elevated levels of plasma stress parameters of overall increasing trends and mild but distinct alterations in gill histology at 72 h post-drop. On the other hand, fish exposed to salinity drop from 34 to 26 PSU seems to mount stress from salinity change or might already pass the adjustment phase and reach a new homeostasis. Therefore, the no observed adverse effect levels for 72 h acute salinity challenge was 26 PSU in our study, and acute salinity drop to 18 PSU and below can possibly cause acute adverse effect, which could make the fish in this size vulnerable to possible additional stresses such as a temperature fluctuation. Additional studies with longer experimental duration promise establishing more definitive conclusion on salinity responses of this species.
