INTRODUCTION
The time line from hatching to the first food intake can vary according to (1) developmental capacity, (2) efficiency in using the yolk food supply, and (3) internal functions related to food storage (Park & Zhang, 1998; Rust, 2002). Many fish undergo natural periods of starvation, which may be seasonal but are not always. Fish, like other vertebrates, can reduce their energy demand during food deprivation, sometimes by lowering their average metabolic rate during such periods (Johnson, 1989). Fish starvation studies are significant in determining the fish’s nutritional and growth characteristics (Love, 1980). Many fish species undergo natural periods of starvation during the year, and have consequently evolved the capacity to withstand prolonged food shortages. Such periods may extend from weeks, months, to even years, and may cause extensive loss of energy stores in the body of the fish consumes its own tissues to remain alive (Weatherley & Gill, 1987).
The success of feeding and the ability to avoid predators in the period after hatching are likely to be partly affected by the initial size and activity of the larvae, as well as by the capacity of the yolk reserve to meet their metabolic demands (Blaxter & Hempel, 1963). If fish do not have on-time access to their first feed after hatching, they quickly exhaust their endogenous stored energy and lose the ability to swim and find food, thus reaching the point of no return (PNR) (Blaxter & Hempel, 1963). Fish larvae can survive during the fish passing PNR mortality (Myong et al., 1992).
Morphological differences in groups and species are classified in terms of the overall body shape or specific morphoanatomical characteristics (Han et al., 2013). Among the body shape characteristics of fish, morphometric traits, unlike meristic traits, can be measured as mensural characteristics. Although the body shape of fish is largely determined by genetic factors (Lim et al., 2013), the use of morphometric analyses to distinguish genetically discrete groups within a fish species is limited by the difficulty of measuring environmentally induced variations in body shape (Han et al., 2013; Lim et al., 2013).
The rock bream, Oplegnathus fasciatus (Temminck et Schlegel), is widely distributed across the rocky coastal regions of Korea, Japan, Taiwan, and Hawaii (Choi et al., 2002). When they are fry in the shade of drifting seaweed, they mainly eat zooplankton, and when they are grown, they move to the bottom of the sea to live on the sea floor (Choi et al., 2002). When their total length is about 10 cm, they become polyphagic (Choi et al., 2002). The rock bream is relatively easy to mass produce with artificial seeding, so they are a good candidate for aquaculture (Hwang et al., 1996; Kang et al., 1998; Kim et al., 2002).
There is a paucity of data on specific aspects of rock bream breeding and growth, including physiological information on larval survival. The identification in planktonic samples of fish larvae that are starving would be a valuable aide to estimating the early mortality rates of populations in the sea. The early survival rate of marine fish is determined by the PNR, which is the point at which fish must find external nutrients after exhausting their internal nutrient source (the yolk) (O’Connell, 1976; Theilacker, 1978; Strüssmann & Takashima, 1990; Park et al., 1998; Lee et al., 1998). Shan et al. (2008) previously reported that effects of delayed first feeding on growth and survival of rock bream. In this study, we focus on morphological changes in rock bream larvae to starvation and investigated their yolk absorbance.
MATERIALS AND METHODS
To conduct a starvation experiment on the larvae of the rock bream, Oplegnathus fasciatus, eggs were hatched and the fry were then separated into approximately 500 fish per tank (volume: 20 tons). The fed group was given cultured rotifers, Israchionus plicatilis, whereas the unfed group was unfed. The water temperature was 24.0°C, the dissolved oxygen 6.5 ppm, and the specific gravity 1,023.
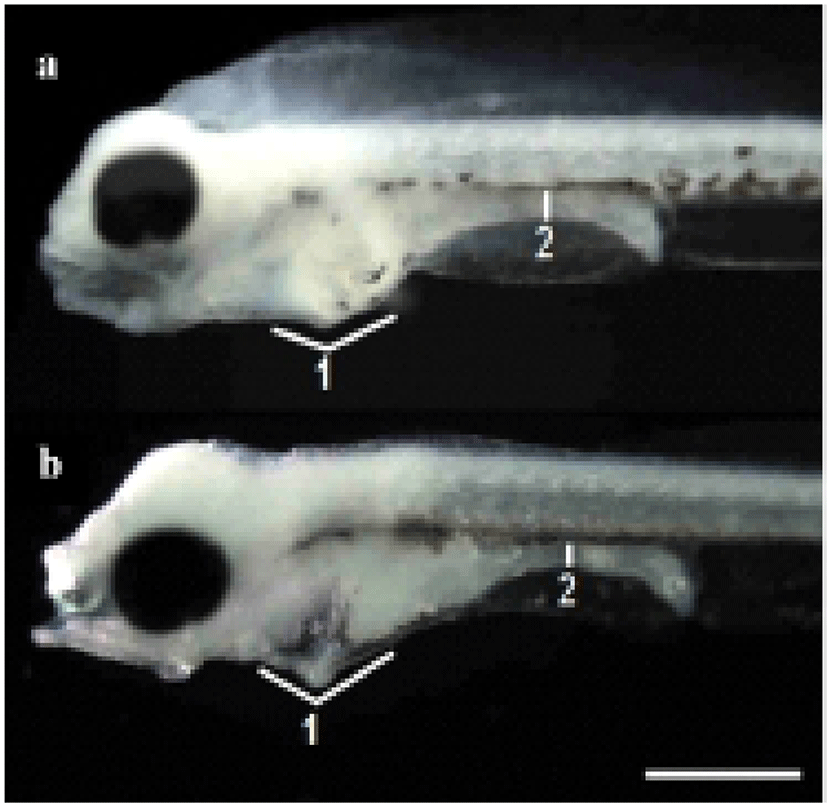
The termination point of the experiment was determined when the specimens exhibited an abrupt reduction in vitality. The survival rate was ascertained from the time the larvae were exposed to starvation. Every day, 20 larvae were extracted from each tank and fixed in neutral formalin (100 ml of formalin, 6.5 g of Na2HPO4 • 12H2O, 4.5 g of KH2PO4 in 900 ml of distilled water) for 24 h, after which their morphometric traits were measured using a biological microscope (Axiostar Plus, Carl Zeiss, Germany) with an eyepiece micrometer for compared with the morphological difference (Fig. 1).
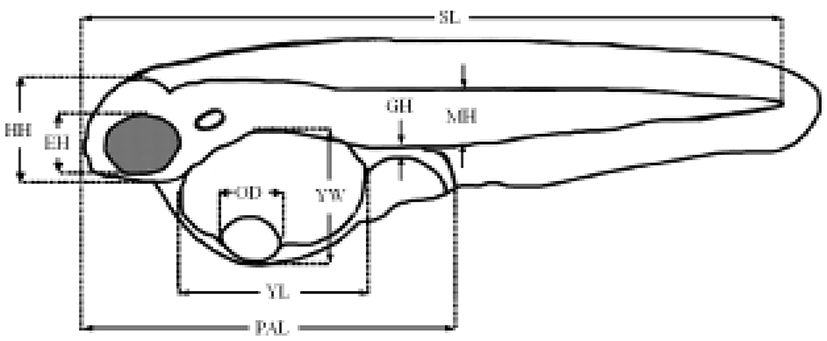
The experiment was performed in triplicate. To study the size and changes in the yolk structure, the yolk size was examined in the fed and starvation groups. The size of the yolk was calculated and measured according to the method described by Blaxter & Hempel (1966): yolk size = (π/6)×LW2 (L: length of yolk; W: width of yolk).
We also examined the increase in the standard length, the percentage of eye height/head height, the percentage of preanal length/standard length, the percentage of gut height/standard length, the percentage of arthromere height/standard length, the percentage of gut height/arthromere height, and the pectoral angle during starvation.
RESULTS
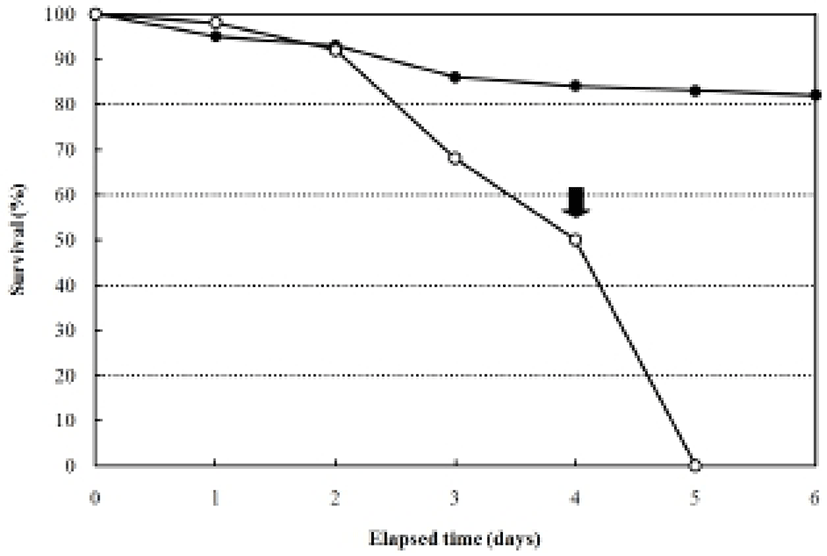
The larvae of the rock bream, Oplegnathus fasciatus, in the unfed group were all dead after five days from hatching, coincident with an abrupt loss of vitality (Fig. 2). Fig. 2 shows that the survival of the fed group was 84% six days after hatching, whereas that of the unfed group was 93.1% two days after hatching, 67.1% at three days, 50.0% at four days, and zero on the 5th day. The yolk of the unfed group was completely absorbed by the third day, whereas absorption of the yolk and the oil globule diameter were completed in the fed group four days after thatching (Table 1).

|
The increase in the standard length (SL) of the fed group was 3.0±0.12 mm, and it grew constantly, reaching in 4.9±0.27 mm six days after hatching. In contrast, the SL of the unfed group was 3.0±0.20 mm after four days, and it had decreased to 2.7±0.18 mm five days after hatching (Fig. 3). The ratio of eye height/head height in the fed group was 51.4±3.27% after hatching and remained constant (50.2-53.1%) for six days after hatching (Fig. 4). However, the ratio of eye height/head height increased after hatching in the unfed group, reaching 83.2±0.68% after six days (Fig. 4).
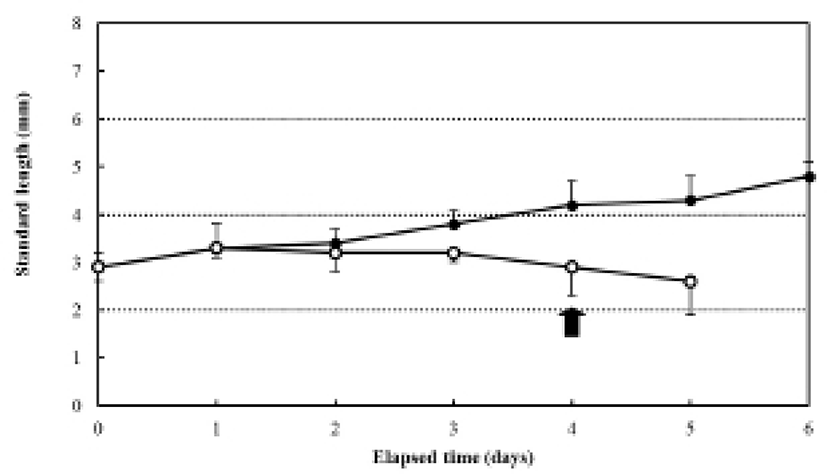
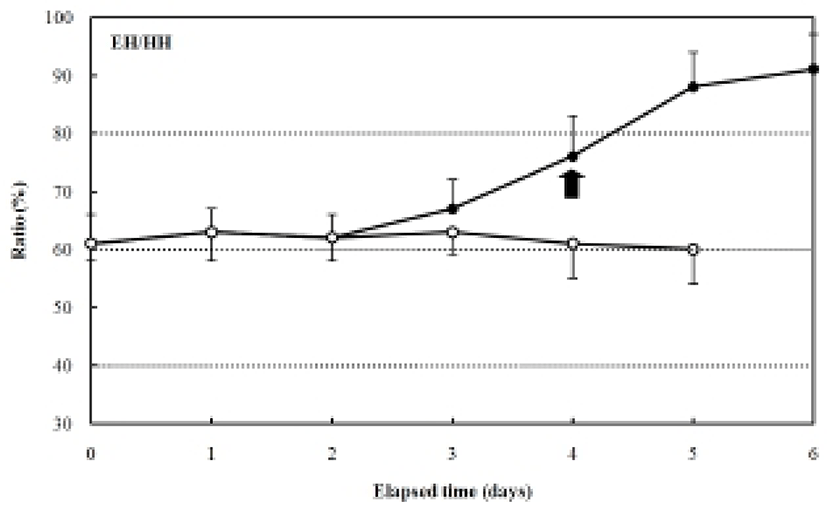
Fig. 5 shows the changes in the preanal length/standard length, gut height/standard length, and myotome height/standard length ratios. The ratio of preanal length/standard length after hatching was 53.8±0.32%, and decreased continually in the fed group to 47.0±0.39% after six days. The unfed group showed a larger reduction in the preanal length/standard length ratio compared with the fed group, with a ratio of 30.1±0.31% after five days. The ratio of gut height/standard length was 3.7±0.12% after hatching, and 3.4±0.22% after six days in the fed group. However, in the unfed group, this ratio was 3.8±0.23% two days after hatching and showed a rapidly decreasing trend to 0.8±0.07% after five days (Fig. 6).
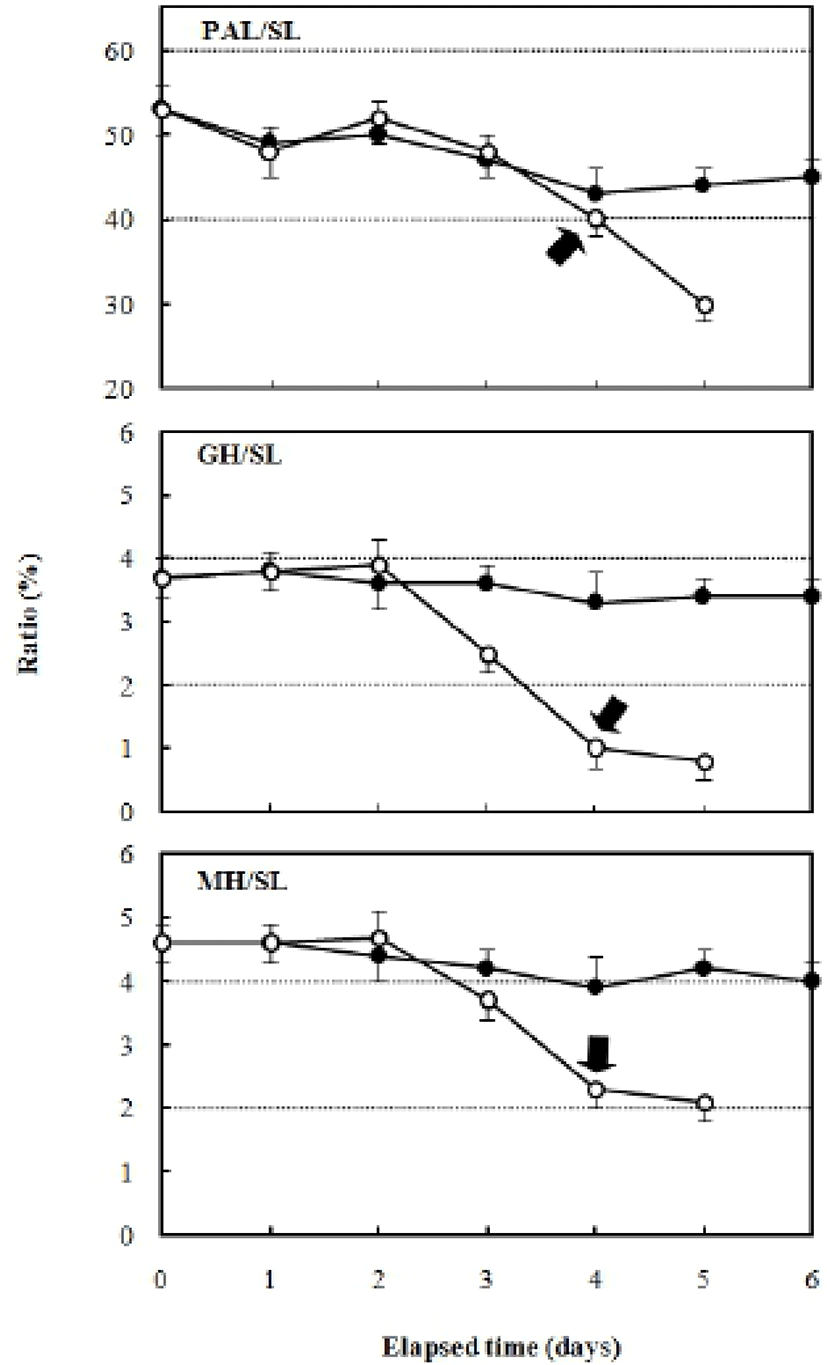
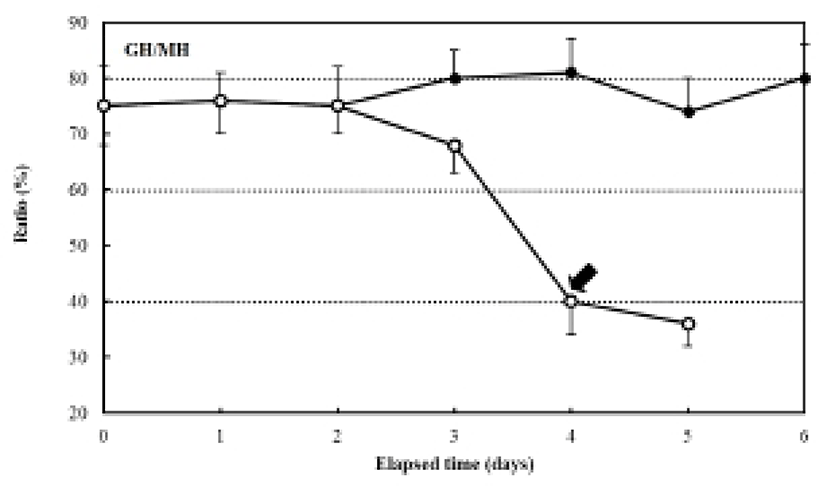
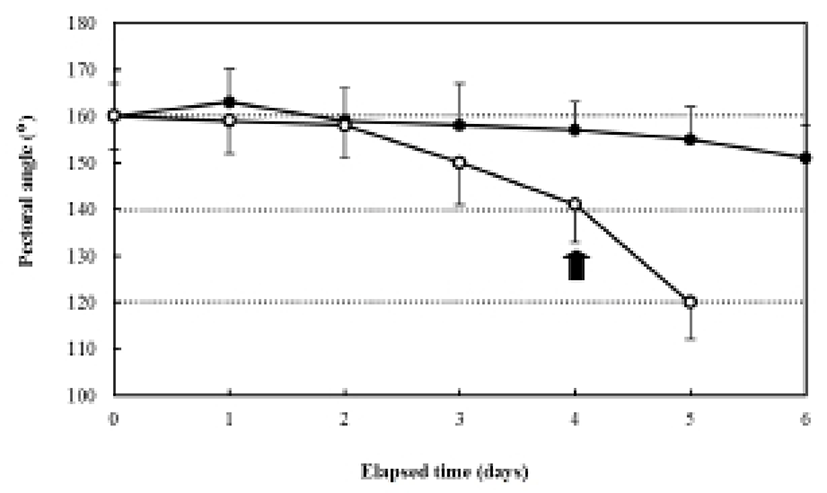
The ratio of myotome height/standard length after hatching was 4.9±0.27%, and it was 4.3±0.39% in the fed group after six days. In contrast, the unfed group showed a ratio of 5.0±0.31% after two days, which had declined to 2.3±0.20% five days after hatching. The ratio of gut height/myotome height after hatching was 75.0±0.47% (Fig. 7). In the fed group, this had increased to 78.6± 6.9% after six days, whereas it was 75.0±5.27% in the unfed group after two days, and then declined to 33.3± 3.62% five days after hatching (Fig. 7). The pectoral angle was 160±11.7° upon hatching and showed a general reduction to 150±9.8° in the fed group after six days (Fig. 8). In contrast, the pectoral angle of the unfed group was 120±8.8° after five days (Fig. 8).
DISCUSSION
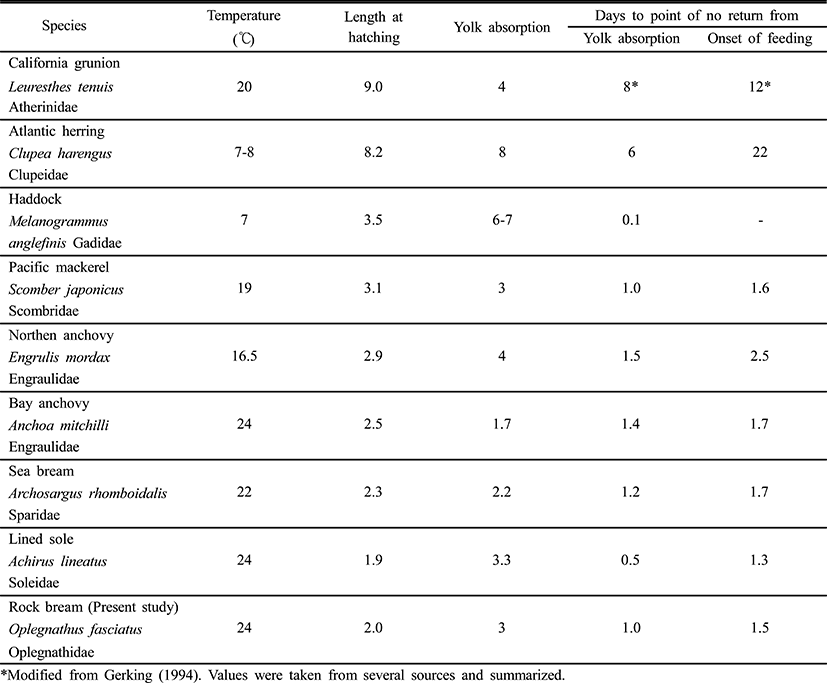
The period immediately after the absorption of the yolk supply, usually completed within three days after hatching, is critical for fish larvae. This is when a successful transition from inner nutrient intake to external nutrient intake must be made (Farris, 1960). According to Blaxter & Hempel (1963), approximately 50% of larvae can begin access an external food supply four days after hatching (Table 2). According to the feeding time and the ability to resist starvation in fish larvae, the feeding patterns were divided into two types: type A, the feeding rate was low at first feeding time, then rapidly increased, followed by a remarkable decrease; and type B, the feeding rate was low at first feeding time, rapidly increased and kept stable for a period of time at the highest feeding rate, and then rapidly decreased. The rock bream belong to type A (Shan et al., 2008).
|
In order to determine the ability of the fish to resume eating after a period of starvation, the PNR (Point-of-No-Return) concept has been introduced (Blaxter & Hempel, 1963). PNR refers to the point at which a state of constantly maintained starvation proves sufficient to prevent exactly 50% of fries from resuming feeding after a food supply is re-established. PNR is determined via observations of the vitality of fishes, as well as water temperature, which is the principal environmental factor that determines metabolism during starvation. Also, the beginning point of PNR has been measured from both the time of fertilization and the time of yolk absorption, depending on the investigator’s objective (Blaxter & Hempel, 1963; Weatherley & Gill, 1987).
The rock bream, Oplegnathus fasciatus, has enough yolk supply to survive for two days without feeding. This is similar to the Northern anchovy, Engraulis mordax, whereas the California grunion, Leuresthes tenuis, which has large larvae that hatch from big eggs, can survive for more than eight days before exhausting their yolk supply (May, 1974). According to May (1974), the California grunion can survive a further eight days (16 days in total) of starvation after the exhaustion of its yolk supply before it reaches the PNR. However, the haddock, Melanogrammus aeglefinus, will quickly die if it is not immediately supplied with food after absorbing its yolk (Laurence, 1974). Because water temperature and larval activity are related to increases and reductions in metabolism, the PNR of the black bream, Acanthopagrus schlegeli, is dependent on water temperature (Gerking, 1994). The point of PNR was 4 days after the start of the experiment under starvation conditions with the larval rock bream. PNR was shown to vary due to temperature (Weatherley & Gill, 1987), and varying PNR points have been determined in various fish species, as indicated in Table 2. Small fries hatching from small eggs, such as the Northern anchovy, or Leuresthes tenuis, can survive only 1~2 days after yolk absorption, but big fries hatching from big eggs, including the California grunion.
If the haddock, rockbream does not feed after complete yolk absorption, the fries will die of starvation, but the fries of the chum salmon survived for 22 days after yolk absorption if they were allowed to feed again during this time (Laurence, 1974; Seong et al., 2012). Because different species can survive different periods of starvation, the accumulation of PNR data may facilitate the development of technology allowing for distinctions to be made between good fries and bad fries using the PNR method (Myoung et al., 1997).
The ratio of eye-height/head height in the herring, Clupea harengus, under starvation was 75%, whereas the ratio for plaice, Pleuronectes platessa, under starvation was 60% (Ehrlich et al., 1976). Starvation induces general reductions in the ratios of preanal length/standard length, gut height/standard length, and myotome height/standard length. These data indicate that the digestive capacities of the gut diminish significantly with a lack of feeding, a condition also reported in the codfish, Gadus morhua, the flounder, Platichthys flesus, the red-sea bream, Pagrus major, and the sea bass, Lateolabrax sp. (Yin & Blaxter, 1986; Myong et al., 1990, 1992, 1997). According to Crespo et al. (2001), after experimental starvation, atrophy of the larval digestive structures, pancreatic degeneration, and a lack of supranuclear vacuoles in the larval hindgut were observed. The cause of the reduction in the pectoral angle may that the fat tissue responsible for its buoyancy is utilized by the general metabolism, thus making it difficult for the larvae to search for food and ultimately leading to death (Ehrlich et al., 1976).
Our study do an experiment on the increase in the standard length, the ratio of eye height/head height, the ratio of preanal length/standard length, gut height/standard length, and myotome height/standard length, myotome height/ standard length and the ratio of gut height/myotome height after hatching of fed group and unfed group. Shan et al. (2008) reported that the ratio of head height/standard length, eye diameter/standard length, head height/head length, and the ratio of diameter/head length in fed group and unfed group. Shan et al. (2008) mainly focused on differences of development pattern between fed and unfed group. Our study mainly focused on morphological changes between fed and unfed group. Survival rate decrease and PNR were more quickly than Shan et al. (2008), because that different metabolism according to water temperature.
These morphometric traits are effective indicators of the nutritional status of rock bream larvae. These results also confirm that the initial larval food should be supplied within two days of hatching. Because the critical period and PNR can be affected by external factors such as salinity, diluted oxygen, and the food supply, further studies are required to redress the paucity of data relevant to rock bream culture and mass production.

