
INTRODUCTION
In 1977, DNA sequencing was revolutionized by the simultaneous publication of different methods by Sanger (Sanger et al., 1977) and Gilbert (Maxam & Gilbert, 1977). Their groundbreaking work opened the door to a deep understanding of the genetic code and paved the way for the development of faster and more efficient sequencing technologies. Sanger’s method, known as the dideoxy chain termination method, was found to be more convenient and suitable for optical automatic detection, leading to its widespread use in the life sciences and Sanger’s subsequent Nobel Prize in chemistry in 1980. The development of Sanger’s method was followed by the advent of fluorescent automated sequencing technology, which played a crucial role in the completion of the draft sequence of the human genome in 2001 (Lander et al., 2001; Venter et al., 2001) as part of the Human Genome Project (Abdellah et al., 2004).
Despite its crucial role, Sanger sequencing was limited and expensive for sequencing entire genomes, as demonstrated by the 13-year with thousands of researchers, and 3-billion-dollar project (Collins et al., 2003). The limitations of first-generation sequencing methods led to the development of high-throughput sequencing (HTS) technologies, which are capable of performing massive parallel sequencing of small DNA fragments. In the early 2000s, multiple HTS techniques, called as next-generation sequencing (NGS) (or second-generation sequencing), were developed such as Illumina/Solexa’s Genome Analyzer, Roche/454 pyrosequencing (Margulies et al., 2005), Polonator (Shendure et al., 2005), ABI’s SOLiD (Valouev et al., 2008), Helicos’ Heliscope (Harris et al., 2008), and Thermofisher’s Ion Torrent. Although NGS technologies have greatly improved in many aspects including speed and cost compared to the first-generation sequencing, they still rely on PCR amplification that can cause amplification bias and generates relatively short reads (20–200 bp) that can lead to misassemblies and gaps. To address these issues, third-generation HTS techniques were developed, such as Pacific Biosciences (PacBio) Single Molecule, Real-Time (SMRT) sequencing technology and Oxford Nanopore Technology (ONT). The first PacBio SMRT sequencing platform was released in 2011 that generated longer reads of around 1.5 Kb (now recent SMRT sequencers produce 10–15 Kb reads). ONT enables the generation of reads up to 4 Mb in length technically. Both of them eliminate the need for clonal amplification of the fragmented template DNAs, but their costs are relatively higher compared to second-generation technologies.
With the growing popularity of HTS technologies, a multitude of applications have been developed, such as chromatin immunoprecipitation with parallel sequencing (ChIP-seq) and RNA-seq. Several comprehensive reviews introduced HTS technologies, but many of them are challenging for beginners in the field, such as graduate students or wet-lab researchers without a background in HTS, to understand. This review focuses on providing basic knowledge about HTS to understand how HTS technologies work and how they are utilized. Although this information can be found online, this review brings together the knowledge to save beginners time and effort in navigating through a vast amount of information. This review includes a brief overview of four HTS technologies commonly in use today, as well as popular HTS applications.
HIGH-THROUGHPUT SEQUENCING (HTS) TECHNOLOGIES
The sequencing principles of the recently popular HTS technologies are outlined in this section. NGS (Illumina sequencing and ThermoFisher’s Ion Torrent) requires clonal amplification and produces short reads (100–400 bp). Third-generation sequencing, including PacBio SMRT sequencing and ONT, produce relatively longer reads (10 Kb to 4 Mb) compared to NGS. Each of the HTS technologies has its own advantages and limitations, making it important to choose the proper technology for the specific application and research goals (Table 1).
HTS, high-throughput sequencing; SMRT, Single Molecule, Real-Time; PacBio, Pacific Biosciences.
After releasing the Genome Analyzer II in 2006, Illumina/Solexa has paved the way for significant improvements in sequencing output and cost reductions over the years. As a result, Illumina machines have become the dominant choice in the HTS market. The sequencing process starts with the clonal amplification of DNA fragments that are ligated to adaptors on a glass slide, known as bridge amplification (Bentley et al., 2008). Incorporated fluorescent nucleotides are read through a cyclic reversible termination method (Fig. 1A). This method sequences the template strand nucleotide by nucleotide through the incorporation of fluorescently labeled nucleotides, washing, imaging, and cleavage. The incorporation of the nucleotides is paused by the use of fluorescently labeled 3′-O-azidomethyl-dNTPs, which allows the removal of unincorporated bases and the determination of the added nucleotide through fluorescent imaging (Guo et al., 2008). The flow cell is then scanned with a CCD camera, the fluorescent moiety and the block are removed, and the process is repeated.
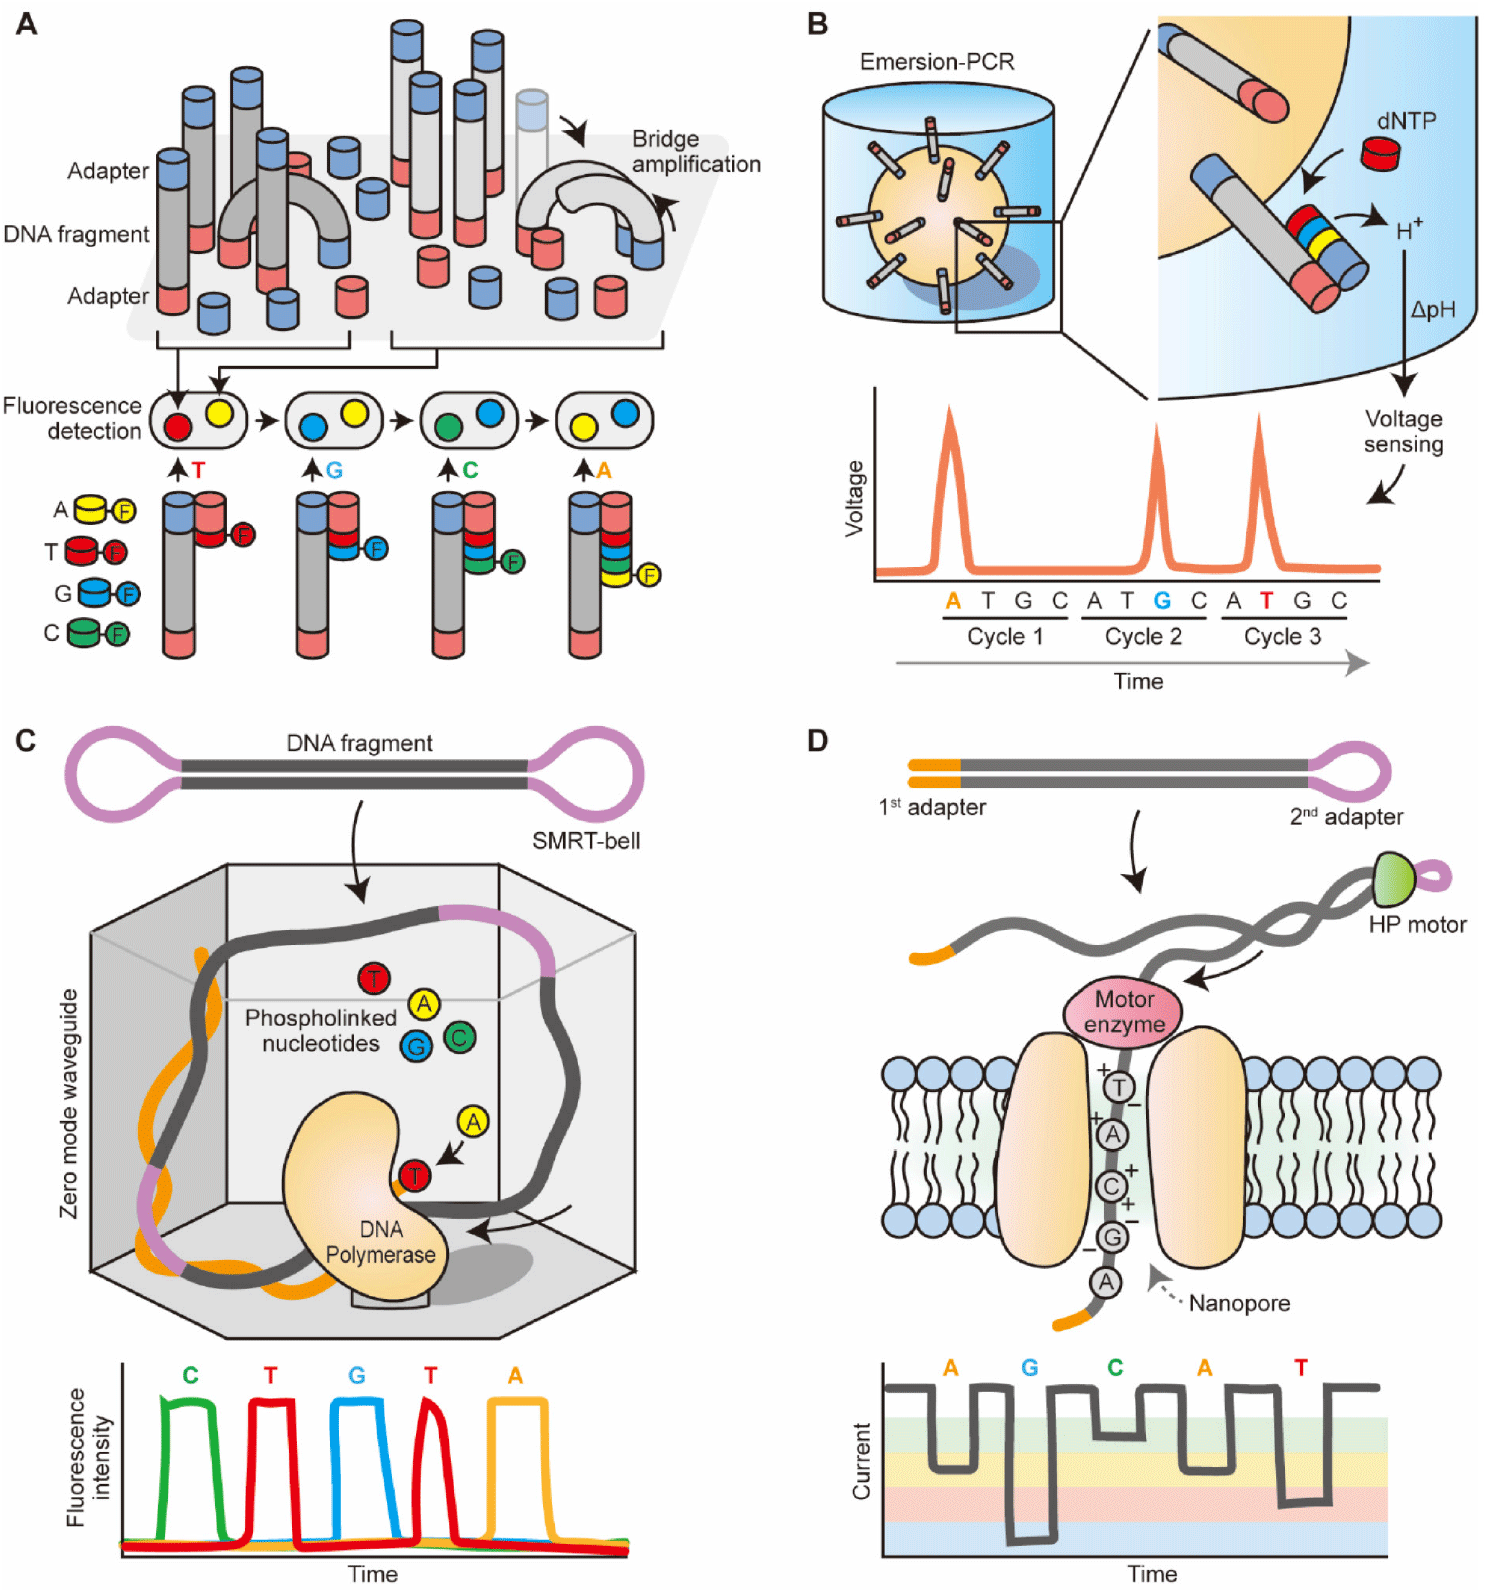
The process of template preparation and clonal amplification of Ion Torrent is similar to Roche/454 pyrosequencing (Margulies et al., 2005), which uses emulsion-PCR to amplify adaptor-ligated DNA fragments on the surface of beads. The beads are then placed in microwells for the sequencing-by-synthesis reaction. Unlike pyrosequencing that identifies nucleotides based on luciferase-based light production, Ion Torrent sequencing is based on the principle of ion sensing technology (Rothberg et al., 2011). Ion Torrent’s semiconductor sequencing measures pH changes caused by the release of hydrogen ions during DNA extension. These pH changes are detected by an ion sensor in the microwells and translated into a voltage signal, which is proportional to the number of bases incorporated. The process is repeated for each nucleotide in the sequence. This allows for base discrimination through the sequential addition of nucleotides in each sequencing cycle, without the need for optical scanning (Fig. 1B). This difference speeds up sequencing runs and reduces costs.
SMRT sequencing, developed by PacBio, is based on single-molecule real-time (SMRT) sequencing technology. During template preparation, single-stranded hairpin adapters are ligated onto the ends of digested DNA or cDNA molecules, creating a capped template (SMRT-bell) (Travers et al., 2010). This process allows the original DNA molecule to be sequenced multiple times, increasing accuracy and avoiding clonal amplification, enabling direct sequencing of native or modified DNA. Sequencing is performed by observing the incorporation of each nucleotide in real-time using zero-mode waveguides (ZMWs) (Levene et al., 2003). The ZMWs are nanoscale wells that contain a single polymerase is immobilized at the bottom, reducing background noise. A single DNA molecule entered into the ZMW, and the incorporation of each nucleotide is monitored as it occurs. This setup allows all four nucleotides in the form of phosphate-labeled versions to be present simultaneously, resulting in continuous polymerization, and real-time sequencing can be achieved through the recording of the fluorescent signals in a video (Eid et al., 2009) (Fig. 1C). SMRT sequencing offers long read lengths and high accuracy, making it suitable for applications requiring high accuracy and long read lengths.
ONTs is leading the development and commercialization of nanopore-based sequencing. This method is centered around the passage of DNA or individual nucleotides through a tiny protein channel (i.e., nanopore) (Pennisi, 2012a). Current Oxford Nanopore’s technology involves hundreds of micro-wells in a sequencing flow cell, and each well contains biological nanopores. The sequencing process involves measuring the changes in electrical current as each nucleotide passes through the pore (Kasianowicz et al., 1996). The identity of the nucleotide is determined based on the specific electrical signature generated by each nucleotide. The library preparation involving fragmenting DNA and attaching adapters can be done without clonal amplification. The first adapter is bound with a proprietary motor enzyme, and the second adapter is a hairpin oligonucleotide that is connected by a HP motor protein, allowing for accurate sequencing of both strands of DNA from a single molecule (Fig. 1D). Oxford Nanopore sequencing offers long read lengths and high accuracy for longer read lengths, making it suitable for applications requiring high accuracy and long read lengths. ONT has also developed a low-cost and portable sequencer called minion (Quick et al., 2014), which allows individual researchers to access HTS technologies.
HIGH-THROUGHPUT SEQUENCING (HTS) APPLICATIONS
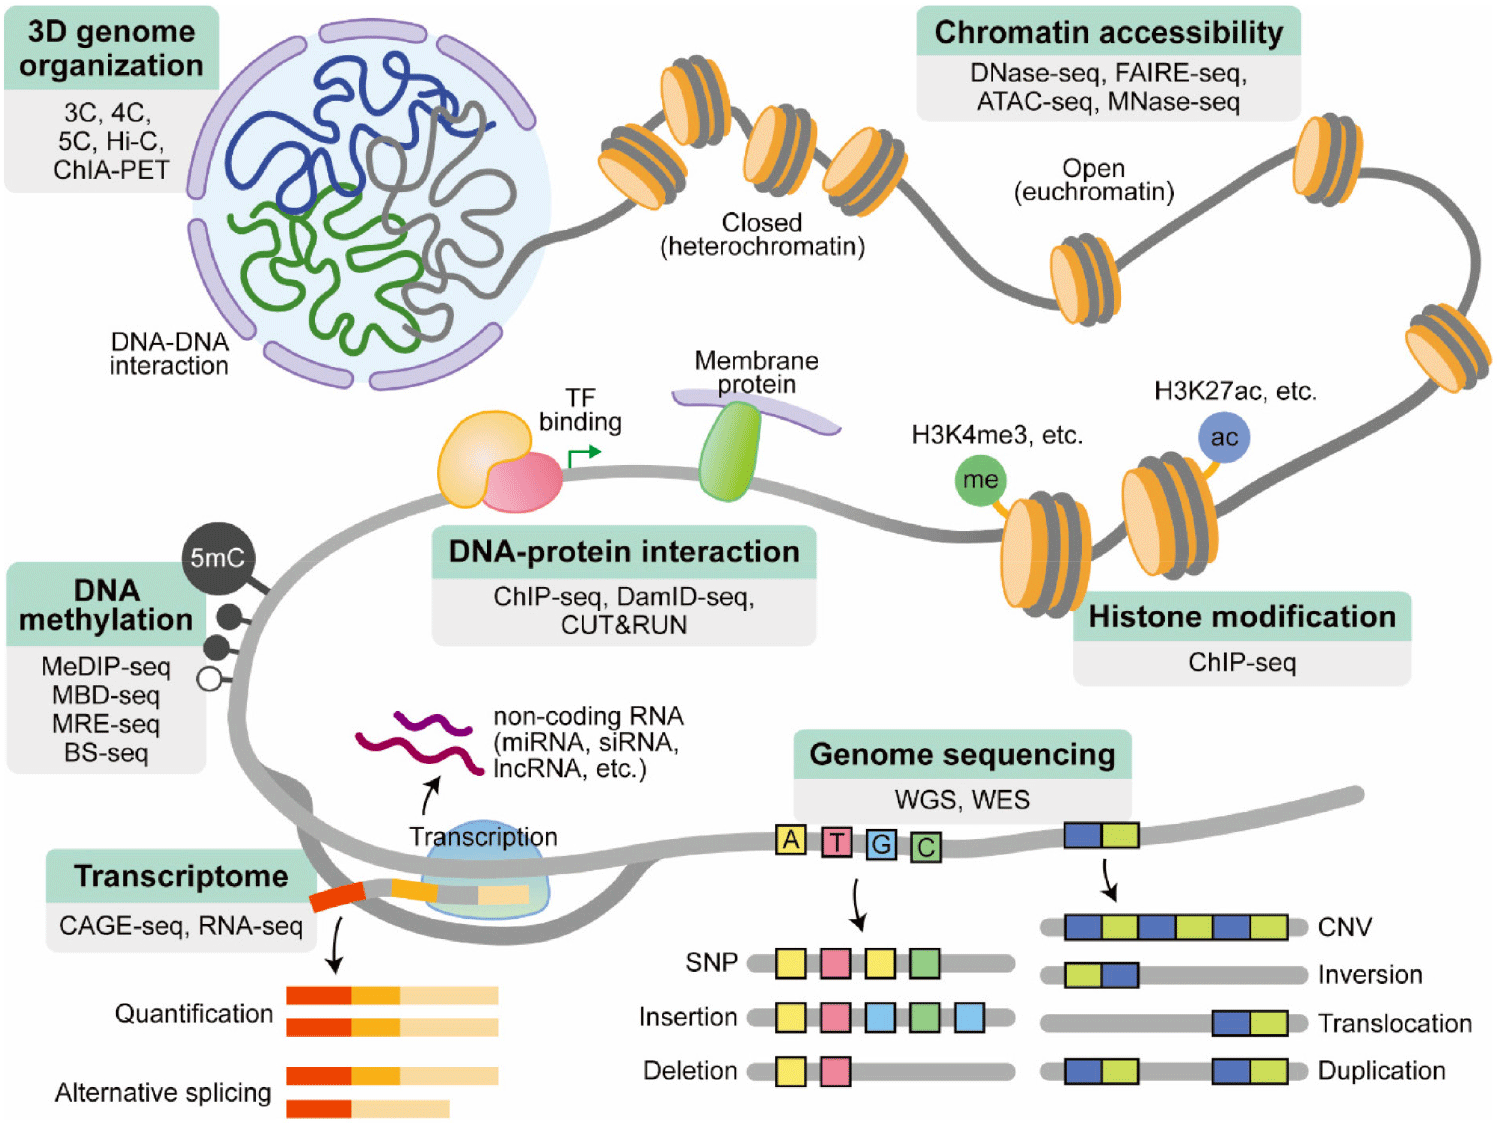
The widespread availability of HTS machines has been made possible by the decreasing cost of sequencing. The drop in cost and improved accessibility have allowed for the development of a wide range of HTS applications. The growing robustness of HTS-based applications has not only empowered individual researchers, but also enabled large-scale consortia-based projects. These projects provide valuable resources to the scientific community and address questions that would be challenging for individual labs to tackle. These projects include characterizing the human genome [The Encyclopedia of DNA Elements (ENCODE)] (Dunham et al., 2012; Roadmap Epigenomics Consortium et al., 2015), studying human genetic variation (The 1000 Genomes Project Consortium, 2010) (Abecasis et al., 2010), analyzing gene expression (GTEx; https://gtexportal.org/home/), and uncovering the molecular basis of human disease (multiple projects) (Reuter et al., 2015). These collaborative efforts result in foundational resources of high value to the scientific community, as the data is deposited into easily accessible public databases. The use of HTS applications by both individual labs and large consortia has opened up new avenues of discovery in biology. This section introduces some widely used applications (Fig. 2).
As briefly mentioned in the previous section, HTS typically involves fragmentation of the genome into smaller pieces and sequencing them randomly, a process known as “shotgun sequencing”. This requires utilizing computational techniques to reassemble the fragmented sequences into a complete representation of the genome like a jigsaw puzzle. Alignment to a reference genome is a way of arranging DNA/RNA sequences based on their similarity to the reference genome. De novo assembly is another method for constructing a genome without prior knowledge of the correct sequence, leading to the discovery of new genomic regions, variations, and even species. However, this method is more computationally intensive and time-consuming than reference alignment, and as a result, its use is limited (usually applied in genome sequencing of novel species or strain). Alignment to a reference genome is more commonly used due to its simplicity, making it a popular choice for various applications.
The field of genome sequencing has seen tremendous growth and advancement in recent years, thanks in large part to the development of HTS technologies. The first genome to be sequenced using HTS was that of a bacterium (Smith et al., 2007), and as the cost of HTS has decreased and the quality of the outputs has improved, researchers have sequenced an enormous number of different genomes. The use of genome sequencing is prevalent in agriculture to study the genomic characteristics of plants and animals. In the medical field, personal genome sequencing is becoming more popular (e.g., a diagnostic tool for a range of diseases and genetic disorders).
These HTS-based approaches usually use whole genome sequencing (WGS), which allows for the complete genome sequence of an organism to be obtained at a single time. This includes not only the chromosomal DNA, but also the mitochondrial DNA (and chloroplast DNA in plants). The NCBI database holds a million complete genomes currently, the vast majority of which were sequenced after the advent of NGS technologies. Sequencing individual genome is a powerful tool that is increasingly being used to identify important traits and mutations in plants and animals. This technique, known as “resequencing”, involves comparing an individual genome to a reference genome and identifying differences such as single nucleotide polymorphisms (SNPs), insertions/deletions (InDels), and structural variations (e.g., copy number variation, inversion, translocation and duplication) (Stratton, 2008).
Another application of genome sequencing is whole exome sequencing (WES), which entails sequencing the protein-coding regions of genes in a genome (exome) (Ng et al., 2009). The exome represents about 1%–2% of the total genome and contains most of the genetic information that is thought to be responsible for phenotypic variations and diseases. The goal of WES is to identify genetic variants that alter protein sequences, as these variants are believed to have the greatest impact on an organism’s phenotype. This approach provides a more cost-effective alternative to WGS, but it may miss important genomic variations that occur in non-coding regions of the genome.
Cap analysis of gene expression (CAGE or CAGE-seq) and RNA-Seq are two key methods used to study the transcriptome, transcript structure, or the set of all RNA molecules in a cell. CAGE measures the abundance of transcripts by sequencing the 5’ ends of capped RNA molecules, which are the processed forms of mRNAs that are ready for translation (Shiraki et al., 2003; Takahashi et al., 2012). The 5’ cap is a unique structure found on the 5’ end of most eukaryotic mRNAs, making it an ideal target for transcriptome analysis. CAGE is a powerful tool for transcriptome analysis, particularly for identifying novel transcripts and the precise start sites of transcription. However, it has some limitations, including lower sensitivity for low-abundance transcripts and the requirement for the 5’ cap structure, which restricts its use to eukaryotic species.
The principle of RNA-seq is to first extract RNA from a biological sample, then convert it into cDNA using reverse transcription (Nagalakshmi et al., 2008). The resulting cDNA is then fragmented and sequenced. RNA-seq is used for a variety of purposes, including quantifying gene expression levels, which helps to gain a comprehensive understanding of the transcriptome. Additionally, RNA-seq can be used to compare transcriptomes between different samples or conditions, providing insights into changes in gene expression patterns. The technique can also distinguish various isoforms of a gene created through alternative splicing, which can have different functions in diverse tissues or diseases.
Most cells contain high levels of ribosomal RNAs (rRNAs) that make up around 80% of total RNA. Removing rRNAs can enhance the efficiency of mRNA sequencing in terms of cost and time (Zhao et al., 2014). To exclude rRNAs, researchers often use poly(A) RNA selection with oligo(dT) to capture mRNA with 3′ poly(A) tails, which are present on most mature mRNA molecules and are required for translation. However, this method may not capture non-poly(A) RNA, such as non-coding RNAs (ncRNAs; Esteller, 2011; Fatica & Bozzoni, 2014), and poly(A) tail in many bacteria promotes degradation of the mRNA (Régnier & Marujo, 2013). To address these issues, researchers may also use rRNA depletion methods such as hybridization capture (e.g., Ribo-Zero method). The rRNA removal method detect more intronic and intergenic regions of mRNAs than poly(A) selection (Cui et al., 2010). Although the methods described above can effectively remove rRNAs, they may still miss some RNA molecules. As a result, total RNA sequencing is becoming more popular, particularly as HTS techniques continue to improve in terms of speed and cost. Total RNA-seq has the advantage of capturing all types of RNA molecules, including ncRNAs, such as microRNAs, siRNAs, snRNAs, lncRNAs, and snoRNAs (Tuck & Tollervey, 2011). This versatility has led to the development of several applications. For example, small RNA sequencing (ncRNA-seq and miRNA-seq) enables the study of ncRNA functions (Minshall et al., 2022), while strand-specific RNA-seq (ssRNA-seq) determines the orientation of RNA transcripts (Parkhomchuk et al., 2009), which is crucial for correct gene annotation. Additionally, ssRNA-seq highlights the significance of antisense transcription in regulating eukaryotic genes.
HTS has also been used to map epigenetic marks such as DNA methylation across the genome. DNA methylation, which involves the addition of a methyl group to cytosine residues (5-methylcytosine; 5 mC) by DNA methyltransferases (Goll & Bestor, 2005), can silence parts of the genome and regulate biological processes such as cellular differentiation and tissue-specific gene expression (Jones & Takai, 2001). Aberrant DNA methylation, including hypermethylation of tumor-suppressor gene promoters, has been linked to various cancers (Robertson, 2005). DNA methylation is another important means of regulating gene expression through the alteration of chromatin structure, DNA stability, and DNA-protein interactions.
Methylated DNA immunoprecipitation sequencing (MeDIP-Seq), methyl-binding domain sequencing (MBD-Seq), methylation sensitive restriction enzyme sequencing (MRE-seq or MSRE-seq) and BS-seq have been used to map DNA methylation patterns. MeDIP-seq is based on the principle of immunoprecipitation, in which antibodies specific to 5 mC are used to pull down methylated DNA fragments. The resulting methylated DNA fragments are then sequenced to identify the genomic regions that are methylated (Down et al., 2008; Jacinto et al., 2008). MBD-seq is similar to MeDIP-seq, but instead of using antibodies, it uses MBDs that bind specifically to methylated DNA. MBDs are protein domains that selectively recognize and bind to 5 mC. The methylated DNA fragments that are bound by MBDs are then sequenced to identify methylated regions (Serre et al., 2010). MRE-seq utilizes restriction enzymes that can recognize specific DNA sequences and cut the DNA only if the sequence is not methylated (Ball et al., 2009). This sequencing method has limited genome coverage because CpG-containing recognition sites are scarce on the genome. BS-seq includes reduced representation bisulfite sequencing (RRBS) (Meissner et al., 2008) and whole genome bisulfite sequencing (WGBS) (Lister et al., 2009; Smallwood et al., 2014). They are bisulfite-based sequencing methods that converts unmethylated cytosine into uracil, whereas methylated cytosine remains unchanged. The resulting DNA is then sequenced, and the presence of uracil in the sequence is used to infer the absence of methylation. Although RRBS and WGBS have many similarities, RRBS has limited coverage that is mostly restricted to areas with high concentrations of CpG sites (as the name implies). As a result, many regions with low CpG density and some functional enhancers remain uncharacterized. However, RRBS is a more cost-effective method compared to WGBS, which requires high read-depth. The advantages and disadvantages of methods for studying DNA methylation were well described by Yong and colleagues (Yong et al., 2016).
The gene regulation through interactions between DNA and proteins [e.g., transcription factors (TFs)] helps control the expression of specific genes in response to different stimuli and conditions, ensuring the proper functioning of the cell. Additionally, DNA-protein interactions also play a role in maintaining the structure of chromatin and in the repair of DNA damage. The high-resolution mapping of DNA regulatory elements is one particularly impactful use of HTS.
ChIP-seq is a powerful method for mapping the specific binding sites of proteins on DNA, such as TFs, histones, nuclear structural proteins, and other DNA-binding proteins on a genomic scale (Johnson et al., 2007; Robertson et al., 2007). ChIP-seq combines the advantages of both ChIP and HTS. The basic process of ChIP-seq involves crosslinking the protein of interest to the DNA, fragmenting the DNA into smaller pieces, immunoprecipitating the protein-DNA complexes using specific antibodies, amplifying the captured DNA fragments, and then sequencing them. The resulting data provides a map of the genomic regions that are associated with a particular protein and can be used to study the regulation of gene expression, epigenetic modifications, and the function of non-coding regions of the genome.
In contrast with ChIP-seq, DNA adenine methyltransferase identification with parallel sequencing (DamID-seq) does not require chemical cross-linking of protein with DNA or specific antibodies (van Steensel & Henikoff, 2000). It uses a fusion protein containing the protein of interest and DNA adenine methyltransferase from Escherichia coli (Dam) to methylate adenine bases in GATC sequences near binding sites of the protein in the genome. Since adenine methylation is not present in most eukaryotes, DamID provides a unique and specific way to determine the localization of factors (Barras & Marinus, 1989).The modified DNA fragments can be amplified and sequenced to detect the binding sites genome-wide. DamID-seq provides higher resolution and a wider dynamic range than the original DamID method, allowing for the precise localization of protein-DNA interactions. Cleavage under targets & release using nuclease (CUT&RUN) is another option to study protein-DNA interaction (Skene & Henikoff, 2017). It utilizes a recombinant Protein A-fused micrococcal nuclease (pA-MNase) fusion construct that binds to a primary antibody targeting the factor of interest and cleaves the DNA at its binding sites. This results in small DNA fragments that can be isolated from the nucleus and used to create a sequencing library for deep sequencing. CUT&RUN provides close-to-basepair resolution and does not require crosslinking due to its high signal-to-noise ratio for sequencing.
Chromatin accessibility refers to the degree to which the DNA is available for transcription and other biological processes. Relaxed and open chromatin (euchromatin) provides greater accessibility to DNA regulatory elements for transcription. These open regions may be associated with regulatory elements such as promoters, enhancers, and insulators, and can provide insights into gene regulation and other biological processes. When DNA is tightly packed into chromatin (heterochromatin), it is less accessible and transcription is suppressed (Grewal & Jia, 2007; van Steensel & Belmont, 2017).
DNase-seq (DNase I hypersensitive sites sequencing), formaldehyde-assisted isolation of regulatory elements sequencing (FAIRE-seq) and assay for transposase-accessible chromatin sequencing (ATAC-seq) can be used to study chromatin accessibility on a genome-wide scale by mapping the regions of the genome that are more open and accessible. DNase-seq involves treating cells with DNase I, an enzyme that specifically cleaves DNA at sites of relatively high chromatin accessibility (Galas & Schmitz, 1978). The resulting DNA fragments are then sequenced to identify the locations of open chromatin regions (Boyle et al., 2008). FAIRE-seq involves treating cells with formaldehyde to crosslink DNA and proteins, followed by sonication to fragment the DNA (Giresi et al., 2007). The DNA fragments are then purified using a technique called density gradient ultracentrifugation, which separates DNA fragments based on size and density. The purified DNA fragments are sequenced to identify the locations of open chromatin regions in the genome (Gaulton et al., 2010). Unlike DNase-seq, which requires the permeabilization of cells and the isolation of nuclei, the FAIRE-seq protocol can be applied to any cell type without the need for these steps. ATAC-seq is advanced method used to study chromatin accessibility on a genome-wide scale (Buenrostro et al., 2013). It involves using the hyperactive Tn5 transposase to insert small sequencing tags at sites of open chromatin. The tags are then sequenced to identify the locations of open chromatin regions in the genome. ATAC-seq is relatively faster, simpler, and more sensitive than DNase-seq and can be applied to small numbers of cells, even single cells.
Micrococcal nuclease digestion with deep sequencing (MNase-seq) is different with the other three sequencing techniques in terms of their outputs: Analysis of MNase-seq data shows “closed” chromatin (Schones et al., 2008), in contrast to the other methods for studying chromatin accessibility. For example, DNase-seq uses DNase I that specifically cleaves DNA at sites where it is exposed and not protected by histones. On the other hand, MNase-seq uses micrococcal nuclease (MNase) that digests open regions of genome. As a result, DNA regions where it is packaged tightly around histones remain after the digestion and sequenced. Klein and Hainer thoroughly outlined the advantages and disadvantages of the methods for profiling chromatin accessibility (Klein & Hainer, 2020).
The advancement of sequencing technology has facilitated the mapping of DNA-DNA interactions in three dimensions (3D) at both a genomic scale and high resolution. Methods such as 3C, 4C, 5C, and Hi-C enable the analysis of DNA structures in three dimensions. These methods are based on the principles of chromosome conformation capture (3C) (Dekker et al., 2002), which allows to observe interaction one DNA region to another region (one versus one). 4C (circular chromosome conformation capture) is an extension of the 3C method that allows the capture of interactions of a single genomic region with all other regions (one versus all) (Simonis et al., 2006). 5C (chromosome conformation capture carbon copy) is a more comprehensive version of 4C that allows the analysis of interactions between multiple genomic regions (many versus many) (Dostie et al., 2006). All of these methods involve the ligation of a specific genomic region to all its interacting partners, followed by restriction digestion and PCR amplification. However, they were only able to map interactions within specific regions where interactions were already expected and required the design of primers for each region, making them low-throughput.
The advent of HTS technology has given rise to “all versus all” method, Hi-C (Lieberman-Aiden et al., 2009). This method enabled genome-wide mapping of chromosomal 3D structures at low resolution (20–100 Kb). This method does not rely on specific primers, and uses HTS on cross-linked DNA fragments that have been sheared and digested to a specific size to identify all physically close DNA regions. These methods provided new insights into the global organization of eukaryotic genomes and showed that regulatory elements like promoters, enhancers, and insulators come into close proximity to better mediate their functions. They also revealed that chromosomal regions are organized into territories of similar biological activity, known as topologically associated domains (TADs) (Dekker et al., 2013), which are conserved across different mammalian cell types and even across species (Yu & Ren, 2017).
ChIA-PET (chromatin interaction analysis by paired-end tag sequencing) is another application to study genome organization (Fullwood et al., 2009). This method is used to map the interactions of a particular protein or set of proteins with the genome, and to identify specific genomic regions that are in close physical proximity to each other (all vs all with proteins). It uses a combination of ChIP and PET to identify specific interactions between genomic regions, typically between a specific protein and its binding sites on the genome.
The applications discussed above pertain to the investigation of the biological processes within the nucleus. In contrast, microbiome research aims to analyze and understand the microbial “communities”. The microbiome encompasses all the microorganisms, such as bacteria, fungi, and archaea, that coexist in particular environments, such as the ocean, soil, and the animal body. The Human Microbiome Project found extensive variation in microbial communities within different body sites and among individuals (Huttenhower et al., 2012), which linked to human health and diseases (Cho & Blaser, 2012).
Applications of HTS technologies, such as metagenome sequencing and 16S rRNA gene sequencing, allow for the detailed composition and dynamics of whole microbiome in the collected samples. Metagenome sequencing provides a more comprehensive and in-depth view of the community, while 16S rRNA sequencing is more focused on identifying and quantifying different species (Peterson et al., 2021). Metagenome sequencing involves sequencing all the DNA found in a sample, regardless of its origin. This approach offers a comprehensive overview of the microbial community, including details on species diversity and gene composition. Metagenome sequencing recognizes not only previously known species, but it also has the ability to discover new, uncultivated species and gain insights into their functional role in the environment because it does not rely on the characterization of a gene that is uniquely present in microbes to assign taxonomy. 16s rRNA sequencing, in contrast, is a targeted approach that specifically sequences the 16S rRNA gene, which is conserved across all bacteria and archaea. The 16S rRNA gene is used to classify and identify different species of microorganisms due to its slow rate of evolution, and the sequencing data is analyzed to determine the relative abundance and diversity of different species in a sample (Woese & Fox, 1977; Stackebrandt & Goebel, 1994). This method is more cost-effective to observe microbial species than metagenome sequencing.
While this review focuses on some popular HTS applications, hundreds of others are available. These include ribosome sequencing (Ribo-seq) to measure translational efficiency (Ingolia et al., 2009), replication sequencing (Repli-seq) to examine DNA replication during the cell cycle (Scott Hansen et al., 2010), global run-on sequencing (GRO-seq) (Core et al., 2008), Nascent-seq (Khodor et al., 2011) and native elongating transcript sequencing (NET-seq) (Churchman & Weissman, 2011) to study nascent transcripts bound to RNA Pol II, RNA-immunoprecipitation sequencing (RIP-seq) to investigate RNA-protein interactions (Sephton et al., 2011), chromatin isolation by RNA purification sequencing (ChIRP-seq) to examine long ncRNA-chromatin interactions (Chu et al., 2011), Transposon sequencing (Tn-seq) to determine the frequency of mutations within transposons (van Opijnen et al., 2009), single-nucleus chromatin accessibility and mRNA expression sequencing (SNARE-seq) to study transcription and chromatin accessibility in the same cell (Chen et al., 2019), etc.
Tissue-based sequencing methods analyze a bulk sample of cells and provide an average representation of gene expression across a population of cells. This approach can give a general overview of cellular processes and functions, but can obscure important heterogeneity and differences among individual cells. Advent in HTS technologies allow sequencing at single-cell level. This enables to overcome limitations of tissue-based sequencing. Single-cell sequencing technologies allow for the analysis of individual cells, providing a high-resolution view of gene expression and cellular differences (Pennisi, 2012b). This allows for the detection of cellular heterogeneity and the distinction of small cell populations, which can be crucial for understanding complex biological systems such as tumors and tissues containing multiple cell types (e.g., alpha and beta cells in the pancreas, various immune cells in the blood) (Wen & Tang, 2018). Additionally, single-cell sequencing technologies can be used to generate cell maps that provide a comprehensive understanding of cellular diversity and relationships within a tissue. Single-cell sequencing technologies are combined with other HTS applications to use, such as single-cell RNA-seq (scRNA-seq), scATAC-seq, scBS-seq, and scChIP-seq.
CONCLUSION
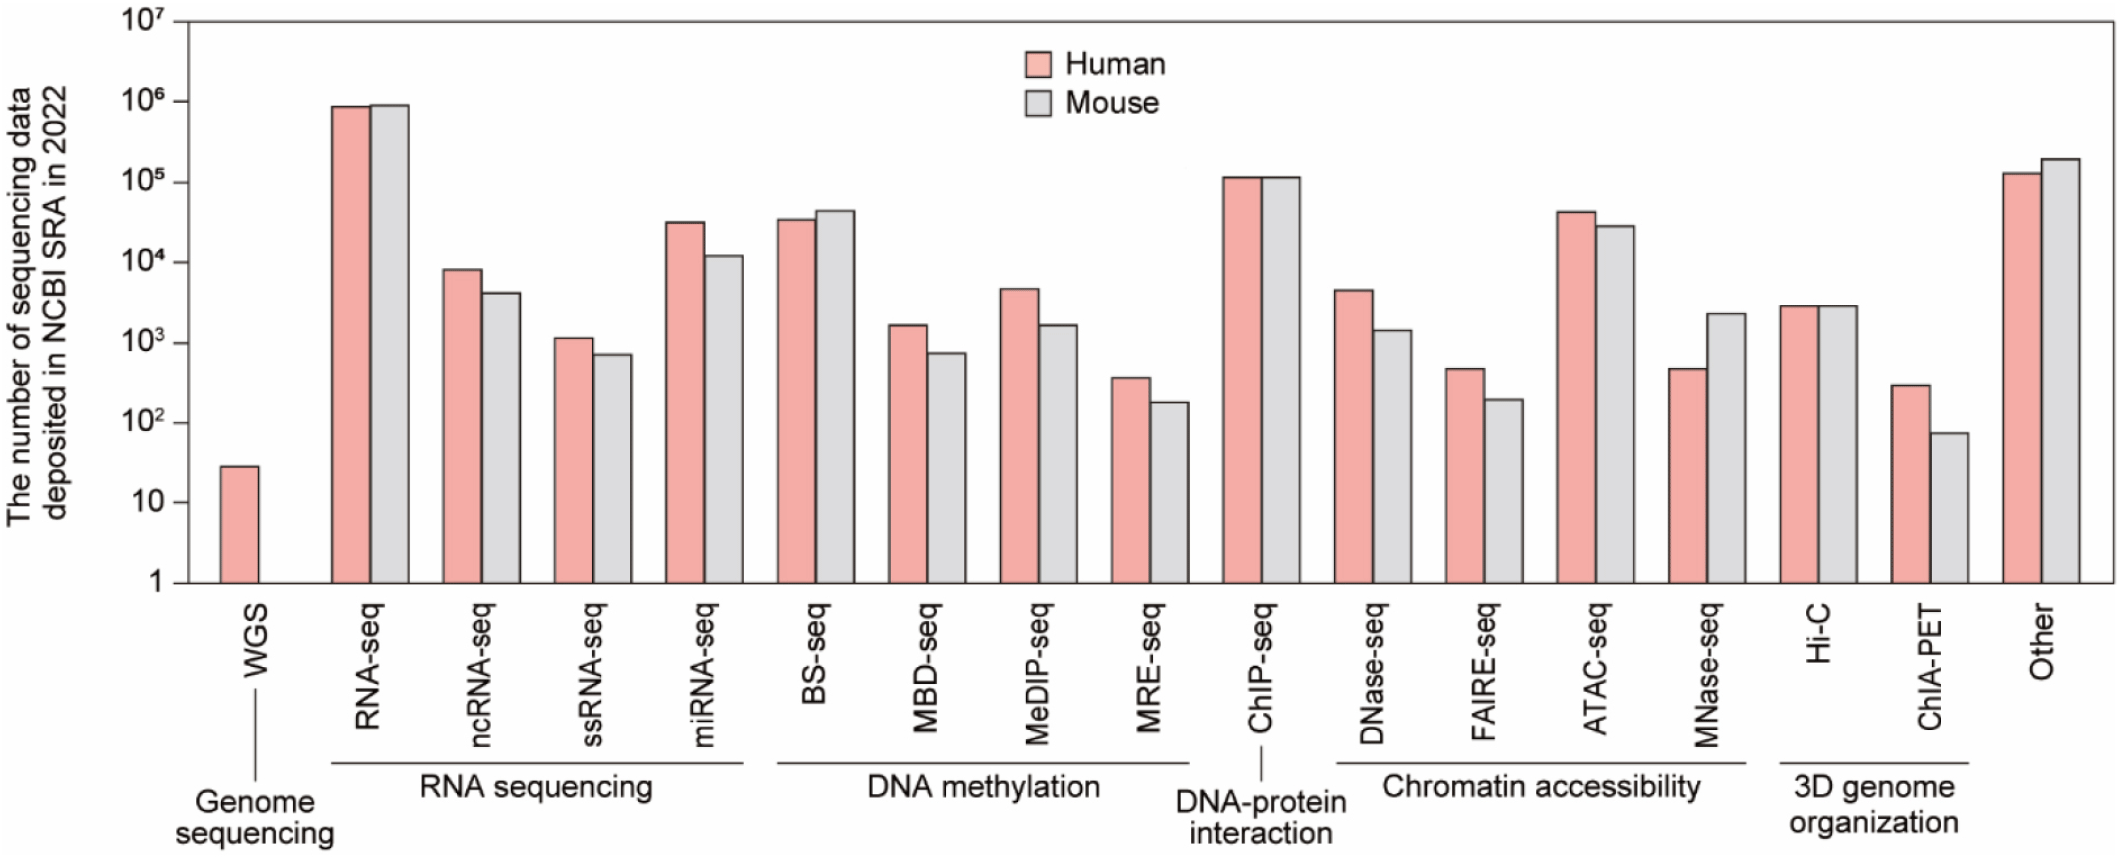
The development of HTS technologies has allowed us to uncover the micro-world we had not known before. Researchers are robustly using HTS to study (meta)genomes on a large scale and at a high resolution, as evident by the exponential growth of the sequencing data volume deposited in NCBI SRA. As of 2022, 3.1 million human sequencing data and 1.7 million mouse sequencing data are deposited, showing a rapid growth of 15.4% compared to 2021 (Fig. 3). The significance of sequencing data in driving breakthroughs in research has become increasingly apparent. As a result, it has become increasingly important for researchers to have a solid understanding of this technology and data analysis skills to effectively interpret and make use of the vast amount of information generated through HTS.
Currently, numerous HTS technologies and applications are constantly being developed and improved, with a focus on speed, accuracy, cost, and scalability. The development of new sequencing platforms and technologies, as well as the integration of sequencing with other omics technologies, will expand the application of HTS in various fields, including medicine, agriculture, and environmental science. The future may see the development of new applications, such as real-time sequencing for disease diagnosis, personalized medicine, and monitoring of pathogens. Additionally, the development of new bioinformatics tools and methods to handle and interpret large-scale sequencing data will play a crucial role in realizing the full potential of HTS technology. Overall, HTS has greatly enhanced our ability to study DNA, RNA, and epigenetic changes, and has opened up new avenues of research that were previously unimaginable. Its significance in research, industrial and clinical settings will continue to grow.