INTRODUCTION
The turtle leg (Pollicipes mitella, 1798), which belongs to the family Pollicipes, is widely distributed in the rock along the shore areas of the southern sea, Jeju island and Ulleungdo island of Korean Peninsula. Generally, the size, type, stripe pattern, and color of this species vary in accordance with water depth, turbidity, nutrition, growth period, water temperature, and other environmental aspects. Research for artificial production has progressed steadily in many aspects, over-catching, and water pollution by industries and city sewage. As this species culture industry grows, so doe’s interest into the genetics of this species. However, little information currently exists regarding the genetics of this species.
Many molecular/genetic studies have employed this technique, as this PCR method is a reliable, easy, and relatively speedy method for the investigation of numerous genomic DNAs, which can help in the determination of the degree of genetic diversity in a given population. Another benefit of this method is that it requires no prior knowledge of the genome for its efficiency (Welsh & McClelland, 1990; Welsh et al., 1991; Iyengar et al., 2000; Klinbunga et al., 2000).
In the present study, these authors performed a hierarchical clustering analysis to make clear the genetic differences and geographic variations among different individuals of the Tongyeong, Yeosu and Manjaedo population of Pollicipes mitella, respectively, collected in the southern sea by PCR analysis.
MATERIALS AND METHODS
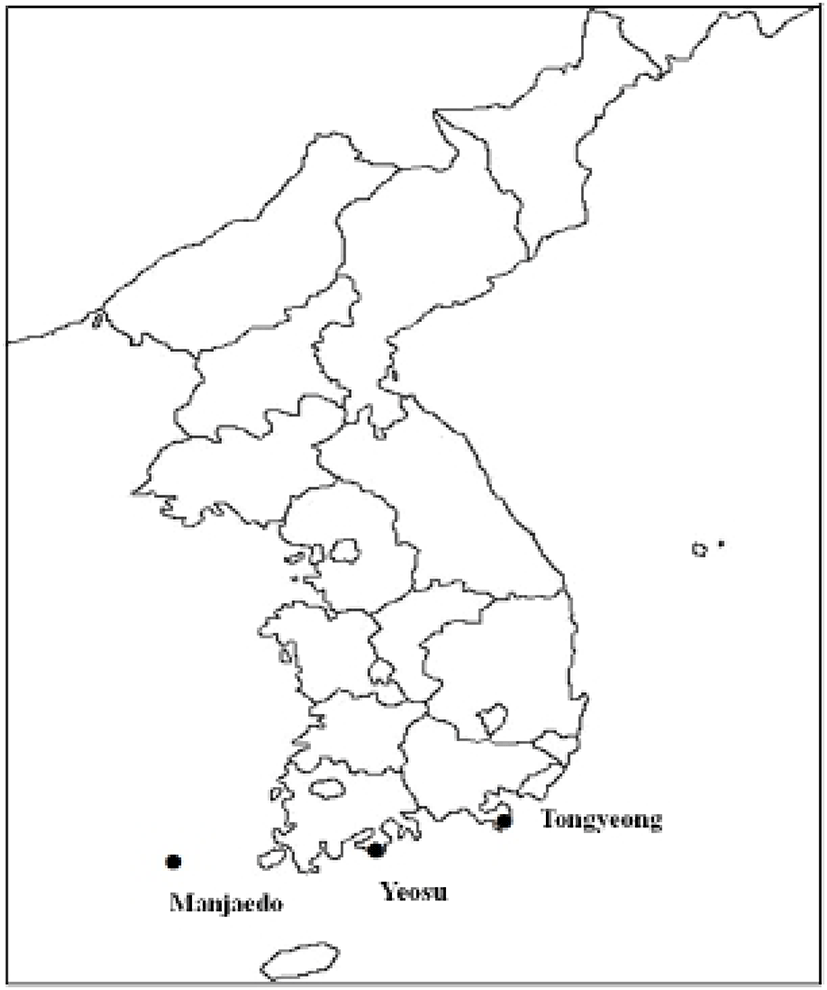
Genomic DNAs were separated from 33 individuals of three turtle leg (P. mitella) populations of Tongyeong, Yeosu and Manjaedo located in the southern sea of Korea, as shown in Fig. 1. DNA extraction and/or purification were performed as described previously (Yoon, 2008). In order to achieve good results, DNA extraction should be performed with highest reagent (Bioneer Corp., Daejeon, Korea) and according to standard procedures with minor modification. After washings several times, 3 volumes of lysis buffer I (155 mM NH4Cl; 10 mM KHCO3; 1 mM EDTA) was added and mixed gently by inverting the tubes. The precipitates obtained were then centrifuged and resuspended in lysis buffer II (10 mM Tris-HCl, pH 8.0; 10 mM EDTA; 100 mM NaCl; 0.5% SDS), and 15 μℓ of proteinase K solution (10 mg/Mℓ) was added. After incubation, we added 300 μℓ of 3 M NaCl, and tenderly pipetted for a few minutes. 600 μℓ of chloroform was then added to the mixture and inverted (no phenol). Ice-cold 70% ethanol was added, and then the samples were centrifuged at 19,621 g for 5 minutes to extract the DNA from the lysates. The DNA pellets were then incubation-dried for more than 10 hours, maintained at –40°C until analysis. The purity and concentration of DNA was measured with the absorbance ratio by a spectrophotometer (Beckman DU 600 series, UK).
Seven primers, BION-45 (5'-CAAACGTCGG-3'), BION-52 (5'-GTGGAAGCGT -3'), BION-55 (5'-GTCACGGACG-3'), BION-58 (5'-AGCCTGTGTC-3'), BION-67 (5'-GTAGACCCGT-3'), BION-76 (5'-GAGGCCCGTT-3') and BION-78 (5'-GGG GGTTAGG-3') were exposed to produce the unique loci to each population and number of shared loci by the three populations of turtle leg which could be evidently calculated. Amplified DNA analysis was performed using two Programmable DNA Thermal Cyclers (MJ Research Inc., Waltham, MA, USA). DNA amplification was performed in 25 μℓ samples, which contained 10 ng of template DNA, 20 μℓ of premix (Bioneer Corp., Daejeon, Korea), and 1 unit of primer. Amplification products were generated via electrophoresis on 1.4% agarose (Bioneer Corp., Daejeon, Korea) gel containing TBE (90 mM Tris, pH 8.5; 90 mM borate; 2.5 mM EDTA) with ethidium bromide. 100 bp ladder marker (Bioneer Corp., Daejeon, Korea) was used as a DNA molecular marker. The electrophoresed agarose gels were photographed by photoman direct copy system (PECA Products, Beloit, WI, USA) under illumination. The degree of variability was calculated by use of the Dice coefficient (F), which is given by the formula: F = 2 nab / (na+nb), where nab is the number of bands shared between the samples a and b, na is the total number of bands for sample a and nb is the total number of bands for sample b (Jeffreys & Morton, 1987; Yoon & Kim, 2004; Yoke-Kqueen & Radu, 2006). The relatedness between different individuals in the three population of turtle leg was generated according to the bandsharing values and similarity matrix. The hierarchical clustering tree was analyzed by the similarity matrices to generate a dendrogram using pc-package program Systat version 10 (SPSS Inc., Chicago, IL, USA).
RESULTS AND DISCUSSION
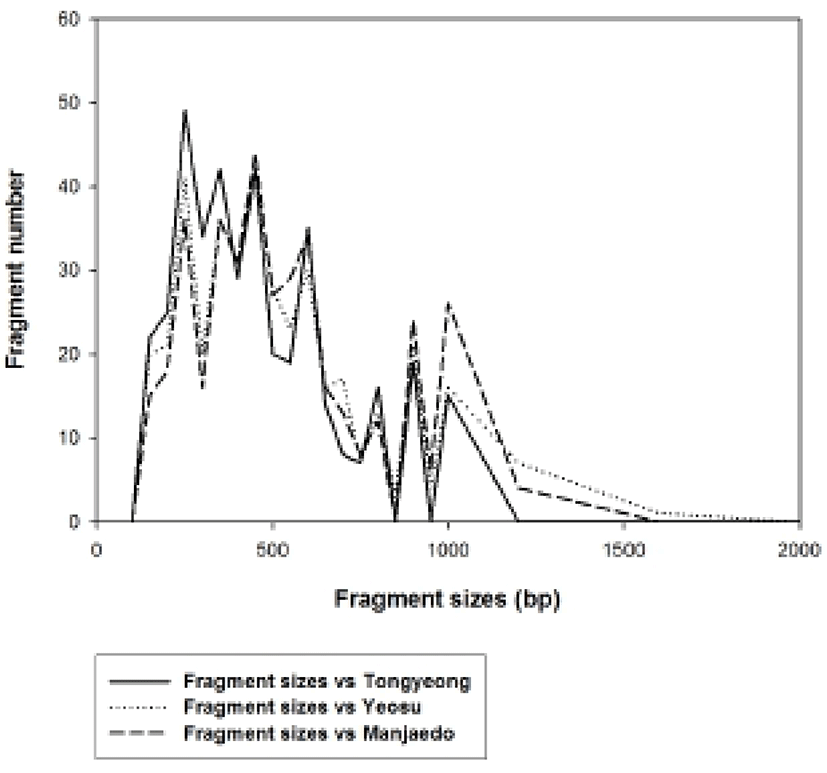
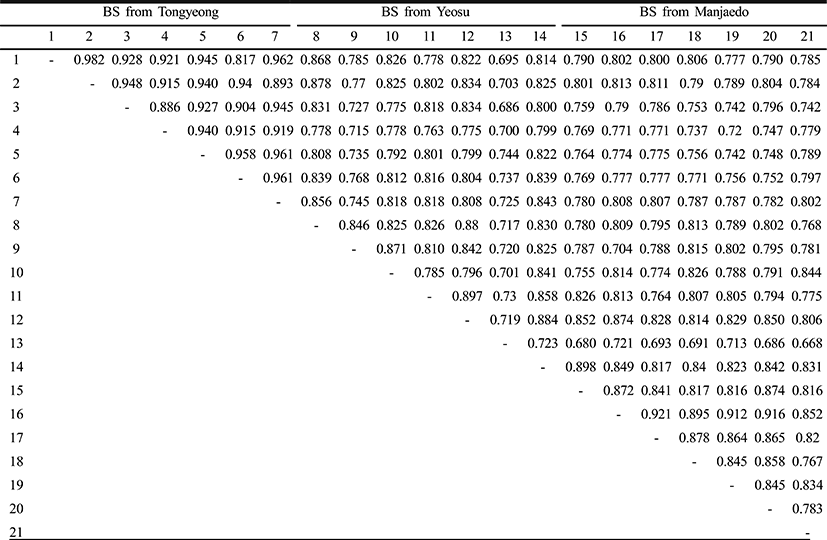
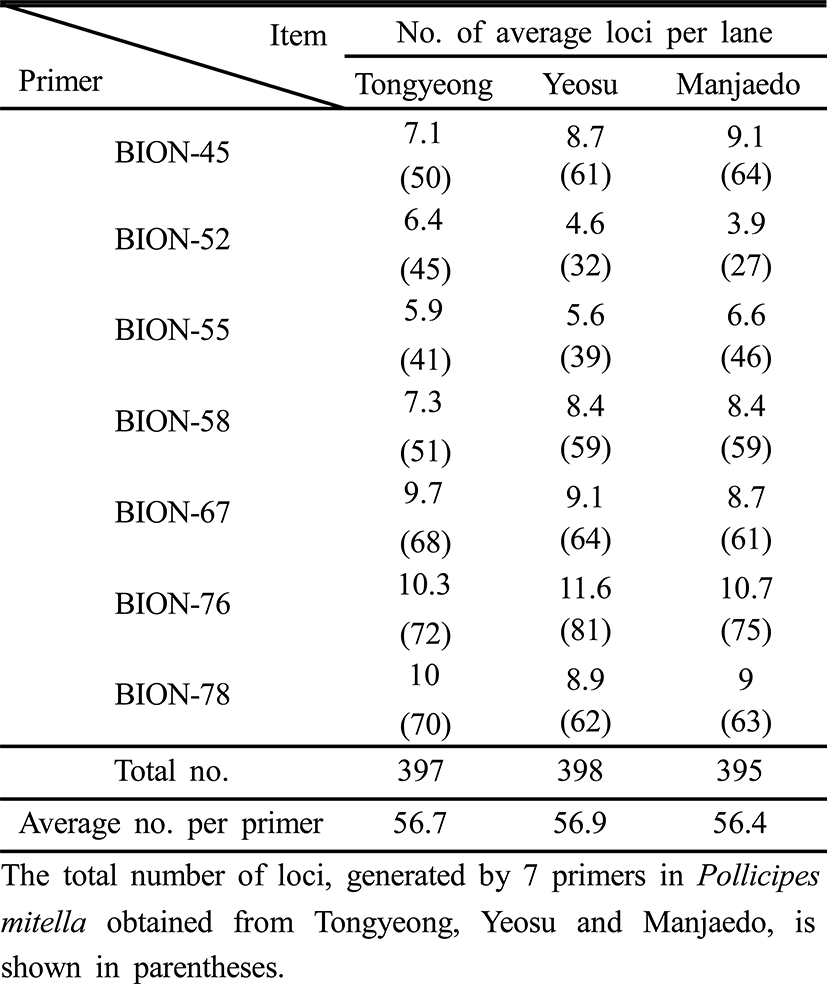
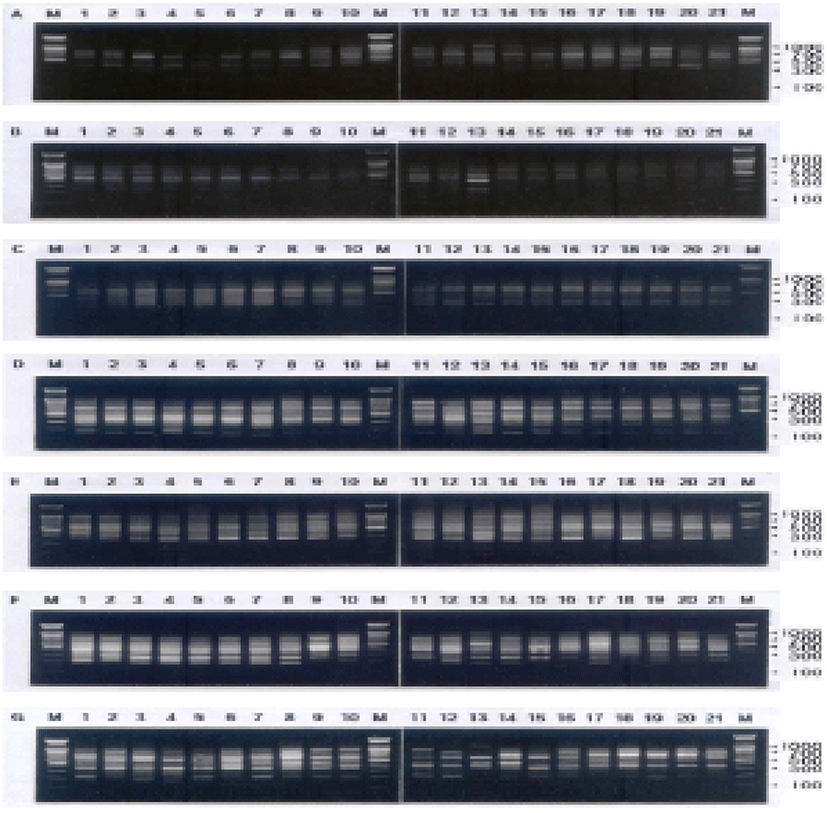
Genomic DNAs were isolated from the turtle leg (P. mitella) populations of Tongyeong, Yeosu and Manjaedo located in the southern sea of the Korean peninsula. Authors assessed genetic variation among individuals of the Tongyeong, Yeosu and Manjaedo population of the turtle leg (P. mitella), respectively, collected in the southern sea by PCR analysis. DNA fragments acquired by seven decamer primers ranged in size from 50 to 1,600 bp in the turtle leg, as shown in Fig. 2. The bandsharing value between individuals no. 01 and no. 02 was 0.982 within the Tongyeong population, which was the highest value identified among the three populations (Table 1). The bandsharing value between individual’s no. 13 of Yeosu population and no. 15 of Manjaedo population was 0.682, which was the lowest observed. All examined primers generated a total of 398 loci counted from the Yeosu population of the turtle leg, while a total of 385 loci were generated from the Manjaedo population, as illustrated in Table 2.
|
|
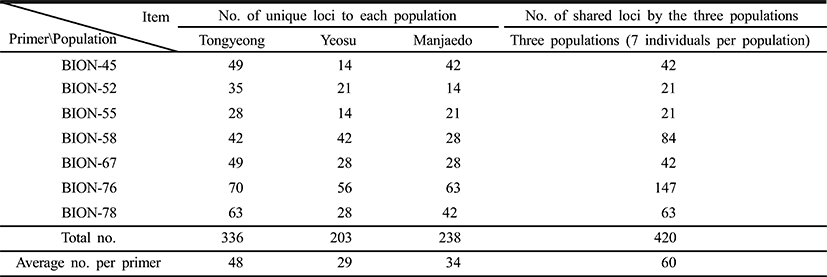
As regards average bandsharing value (BS) results, the turtle leg population from Tongyeong (0.929) exhibited higher bandsharing values than did turtle leg from Manjaedo (0.852), as illustrated in Table 4. This average bandsharing value reported by our study is higher than the value reported for Spanish barbel species (0.71–0.81) (Callejas & Ochando 1998) and the average value between the two oyster populations (0.282 ± 0.008) (Kim et al., 2004). It seems to these authors that this is a result of a high degree of inbreeding in narrow region for a long while. The number of unique loci to each population and number of shared loci by the three populations generated by PCR using 7 decamer primers in the turtle leg (P. mitella) population of Tongyeong, Yeosu and Manjaedo, as illustrated in Table 3. 336 numbers of unique loci to each population, with an average of 48 per primer, were observed in the Tongyeong population. 203 unique loci, with an average of 29 per primer, were identified in the Yeosu population. 238 unique loci, with an average of 34 per primer, were identified in the Manjaedo population. Especially, 420 numbers of shared loci by the three populations, with an average of 60 per primer, were observed in the three turtle leg (P. mitella) populations. Diagnostic markers that are found to be present in three populations of an eel-loach (Pangio sp.) are also considered to be species-specific markers, whereas the other bands were considered to be population-specific markers (Siti Azizah et al., 2005). The higher fragment sizes (>1,200 bp) are much more observed in the Yeosu population, as shown in Figs. 2 and 3.
|

|
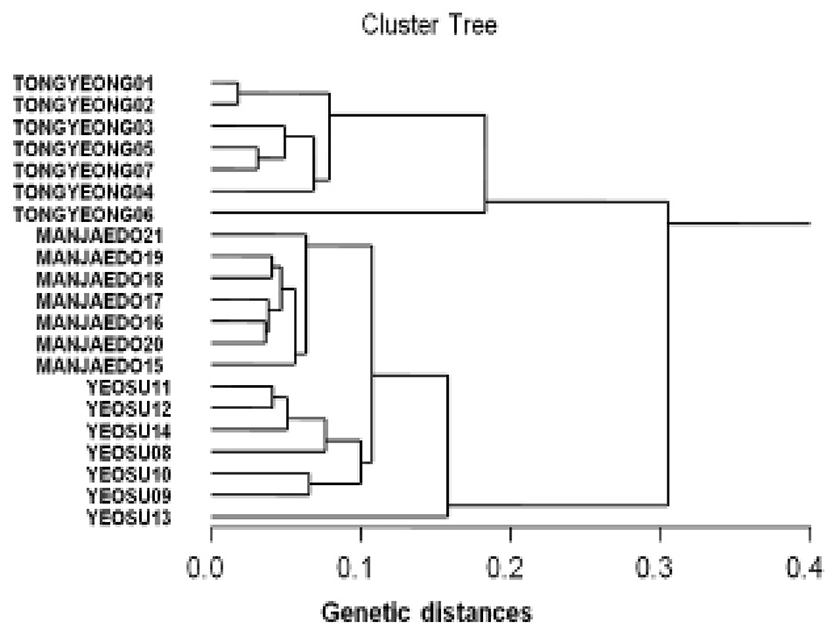
Genetic distances among different individuals of the Tongyeong population of the turtle leg (lane 01–07), Yeosu population of the turtle leg (lane 08–14) and Manjaedo population of the turtle leg (lane 15–21), respectively, were generated using the CLASSIFICATION option in Systat version 10 according to the bandsharing values and similarity matrix, as shown in Fig. 4. The dendrogram, generated by seven trustworthy oligonucleotides primers, indicates three genetic clusters. Tongyeong population could be manifestly distinguished with the other two Yeosu and Manjaedo populations among three populations. The longest genetic distance (0.305) was found to exist between individuals’ no. 02 of the Tongyeong population and no. 13 of the Yeosu population. In this study, genetic analysis has revealed a significant genetic distance among three turtle leg (P. mitella) populations. The shortest genetic distance displaying significant molecular differences was between individual’s no. 01 and no. 02 of the Tongyeong population (0.018).
Three turtle leg (P. mitella) populations can be clearly distinguished, especially, by their morphological characters and PCR-based approach. In general, the population classification of turtle leg is based on morphological variations in body weight, body length, shell size, shell pattern, shell color, and shell length. It is assumed that differences in such characters reflect discrete origins or genetic characteristics (Chenyambuga et al., 2004). Above-mentioned, the prospective of oligonucleotides amplified polymorphic DNAs to identify diagnostic markers for species and population identification in teleosts (Callejas & Ochando, 1998; Yoon & Kim, 2004; Yoon, 2008) and in shellfish (McCormack et al., 2000; Kim et al., 2004; Park & Yoon, 2008) has also been well recognized.

