INTRODUCTION
The olive flounder (Paralichthys olivaceus) is one of the most important marine food source in East Asia. But, aquaculture of olive flounder is seriously affected by various diseases for production and survival. Especially, fish larvae are immediately exposed to various microbes after hatching, thereby information to effective immune system and the development of disease-resistant strains are very important for successful production and increase the survival rate (Zapata et al., 1997).
The complement system play the first line of immune defence as a key component (Nakao & Yano, 1998). The functions of complement are numerous, but it is most well known for its capacity to removal of pathogens by creating pores in their surface membranes (Løvoll et al., 2007). Complement-mediated elimination occurs when directly activated by pathogens or antibody-antigen complexes (Holland & Lambris, 2002). The activation by antibody-antigen complexes makes an important effector mechanism for the adaptive immune response. In addition, complement plays a role in the immune complex clearance and participates in inflammatory reactions such as opsonization, chemotaxis and cell lysis by attracting phagocytic cells to the site of injury (Boshra et al., 2006). One of the specific character of complement is its role in modulating the adaptive immune response by binding to specific receptors on mammalian lymphocyte surfaces (Fearon & Locksley, 1996). Complement thereby provides an important link between adaptive and innate immune responses.
Complement is an essential part of the innate immune system and involves about 20-30 soluble plasma and membrane-bound proteins (Nakao et al., 1998; Sunyer et al., 1998). Pathogen invasion trigger the activation of complement components with a wide range of function. It has been demonstrated that mammalian blood monocytes and tissue macrophages are function of synthesizing a widely various complement components such as C1, C2, C3, C4, C5, factor B, D, H and I (Nathan, 1987). Complement activation can take place through three pathways which the classical complement activation pathway (CCP), the alternative complement pathway (ACP) and the lectin complement pathway (LCP). Complement is initiated by individual or combination of activation pathways and activated by binding of mannose binding lectin (MBL) to carbohydrate structures on microbes (Holland & Lambris, 2002; Ikeda et al., 1987; Matsushita & Fujita, 1995).
C3 is the best characterized component of complement system, playing a central role in all activation pathways. Mammalian C3 is a glycoprotein which composed of two disulfide linked chains (α and β), containing an intrachain thioester bond in the α-chain (Lange et al., 2004a). It can covalently binds with many target cells and participates in control of cell adhesion or cell-to-cell communication (Del Rio-Tsonis et al., 1998). In previous studies, C3 has been identified in primitive protostome species (Zhu et al., 2005) as well as in invertebrate deuterostome species, including echinoderms (Al-Sharif et al., 1998) and tunicates (Smith et al., 1999; Nonaka, 2004). In teleost fish, C3 has been isolated in olive flounder (Aoki et al., 1999), Atlantic cod (Lange et al., 2004a), Atlantic salmon (Martin et al., 2002), rainbow trout (Zakadis et al., 2001), halibut (Lange et al., 2004a), carp (Nakao et al., 2000), seabream (Sunyer et al., 1997), zebrafish (Gongora et al., 1998) and wolffish (Abelseth et al., 2003).
The C3 has been studied with immunohistochemical and real-time PCR analysis in several developmental stages in Atlantic cod (Lange et al., 2004b) and Atlantic halibut (Lange et al., 2004c), and Atlantic salmon (Løvoll et al., 2007). Also, olive flounder C3 gene has been reported that expressed sequence tags (ESTs) (Aoki et al., 1999), microarray analysis (Byon et al., 2006), vaccination induced expression (Dumrongphol et al., 2009) and promoter study using transgenic zebrafish (Yazawa et al., 2005). Although the complement system has been reported in some fish, considerably less is known about the mRNA and protein expression of C3, especially in the early developmental stage. Therefore, we investigate the tissue-specific expression and expression pattern analysis in early development of C3 from the fertilized egg until 28 days post hatching.
MATERIALS AND METHODS
Olive flounder eggs and larvae was obtained from Genetics and Breeding Research Center, National Fisheries Research and Development Institute (NFRDI; Geoje, Republic of Korea). Fertilised eggs from cultured flounder were hatched at 18°C in 5 tons flow through under a natural photoperiod. Different four stages of embryo (~0.92mm) including fertilized egg (F), molura (E1), blastula (E2), late neurula (E3) and ten larval stages (~11.34 mm) including 0 to 28 days post hatching (dph) (H0, H1, H2, H3, H4, H5, H7, H14, H21 and H28) fish kept at 18°C in the sea-water tank. And the sample was prepared from various tissues including kidney, spleen, gill, liver, brain, muscle, fin and eye obtained from adult olive flounder (2-year-old; n=3). These ontogenic samples were observed and determined developmental stage under a microscope system at various magnification. The sample of 10 randomly selected fishes were collected and immediately frozen in liquid nitrogen, and stored at –80°C until RNA extraction.
Total RNA was extracted using the Trizol Reagent (Invitrogen) according to the manufacturer’s protocol. The total RNA concentration was quantified by spectrophotometer and 1 μg of total RNA was used for reverse transcribed into cDNA using First Strand cDNA synthesis kit (Roche). The amplification was performed with AmpliTag Gold DNA Polymerase (Applied Biosystems) in thermal Cycler (Applied Biosystems) using the following parameters: denaturation at 95°C for 10 min and 35 cycles of reactions of denaturation at 98°C for 10 sec, annealing at 58°C for 30 sec, and elongation at 72°C for 30 sec. An aliquot of each PCR product was subjected to 1.2% (w/v) agarose gel electrophoresis and visualized by staining with ethidium bromide.
All the primers were designed using Primer3 (Rozen & Skaletsky 2000). The level of C3 expression was detected using specific primers (C3-F: 5’-GTA CCT CAT CAT GGG CAC ATC-3’ and C3-R: 5’-GTG CTC CTC GGT TTG ACA CT-3’). Housekeeping gene was amplified using beta-actin; 5’-GAG CGT GGC TAC TCC TTC AC-3’ and 5’-AGG AAG GAA GGC TGG AAG AG-3’, Genbank accession number (CX725848), forward and reverse primers, respectively.
To evaluate mRNA levels of C3, primers were specifically designed to detect and quantify cDNA sequences without detecting genomic DNA. The real-time PCR reactions was monitored with melting curve analysis using 7500 software (version 2.0.5). Amplification efficiency was determined by a serial dilutions. All experiments were repeated in tri-replicate. Each reactions displayed an efficiency 95.9% (R2=0.997) and 97% (R2=0.999), C3 and beta-actin, respectively.
Real-time PCR reaction mixture contained 2 μl of diluted sample, PCR primer and the Power SYBR Green PCR Master Mix (Applied Biosystems). Amplification was carried out as follows: denaturation at 95°C for 10 min and 35 cycles of reactions of denaturation at 95°C for 10 sec, annealing at 58°C for 30 sec, and elongation at 72°C for 45 sec. Thermal cycling and fluorescence detection were conducted using the ABI7500 (Applied Biosystems).
The raw threshold cycle (Ct) represents the PCR cycle at which an increase in reporter fluorescence baseline signal can first be detected. The ratio between the housekeeping gene content in standard samples (106 copies) and test samples were defined as the normalization factor. The fold changes of C3 mRNA in different developmental stages or tissues were calculated using standard delta-delta-Ct method (Pfaffl, 2001).
Bioinfomatic analysis was conducted to determine gene identities using Gene Master software (Ensoltek, Beaverton, USA). ESTs were assembled in clusters of contiguous sequences (conting) using ICA tools program (Parsons, 1995). Gene annotation procedures and homology searches of the sequenced ESTs have been locally done by BLASTX for amino acid similarity comparisons. Matches with the expect value (E) less than 1.0×e–4 were considered to be significant. Multiple alignments of the amino acid were constructured using the ClustalW program using default parameters (Thompson, 1994) and visualized with MEGA 3.1 (Kumar et al., 2004).
The data are presented as the mean ± S.D. The mRNA levels of C3 were expressed as a ratio to those beta-actin, which was simultaneously amplified as an internal control for each cDNA. The data was statistically analized by one-way ANOVA after arcsine transformation when needed, and followed by Duncan’s multiple-range test. All experiments were performed two or three times on different batches and differences were considered statistically significant at P<0.05.
RESULTS
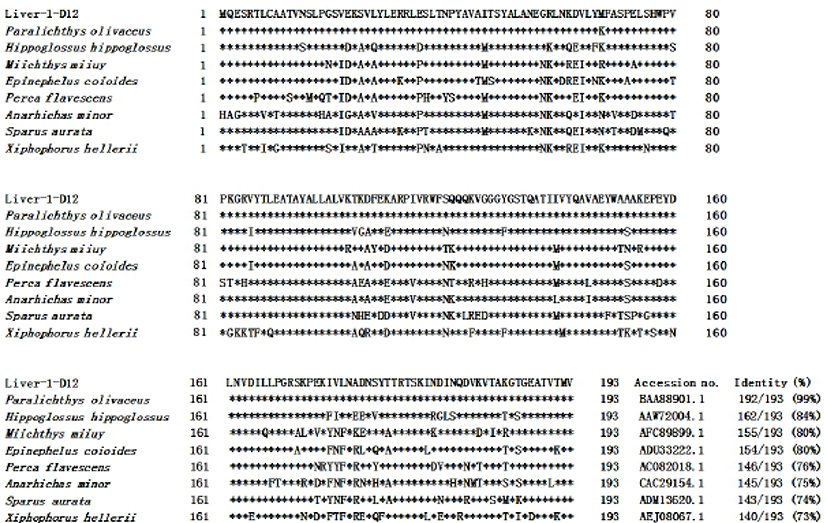
In previous study, we constructed a cDNA library using liver samples of olive flounder and we screened 260 clones (unpublished data). The homologs search of the EST sequence with the corresponding amino acid sequence was examined using BLASTX search of GenBank and sequence alignment was performed with the ClustalW program (http://www.ch.emb net.org/software/ClustalW.html). A GenBank search showed that Liver-1-D12 was revealed to be homologous with olive flounder C3 (BAA88901.1) and has significant high identity above 99%. When compared to C3 of other species were 84% with Atlantic halibut (AAW72004.1), 80% with miiuy croaker (AFC89899.1), 80% with orange-spotted grouper (ADU33222.1), 76% with yellow perch (ACO82018.1), 75% with spotted wolffish (CAC29154.1), 74% with gilthead sea bream (ADM13620.1), and 73% with green swordtail (AEJ08067.1) (Fig. 1). Alignment of amino acid residues of the olive flounder C3 gene with those from other fish indicate a high degree of conservation in the amino acid sequence, therefore we suggest that olive flounder C3 will be similar function another C3.

In previous study, Lange et al. (2004b) described that C3 mRNA was expressed in various tissues including the yolksac, liver, brain, kidney, muscle, eye, notochord, stomach, intestines, pancreas, heart and gills and detected throughout the early larvae period in Atlantic cod (Gadus morhua L.) using immunohistochemistry analysis method. Also, Løvoll et al. (2007) reported that the expression of C3 mRNA was observed the liver and extrahepatic tissues including the heart, muscle, gonads, intestine, skin, kidney, pylorus, spleen and gill in Atlantic salmon. On the other hand, Yazawa et al. (2005) reported that C3 gene was only expressed in the liver that stimulated with lipopoly-saccharide (LPS) from olive flounder.
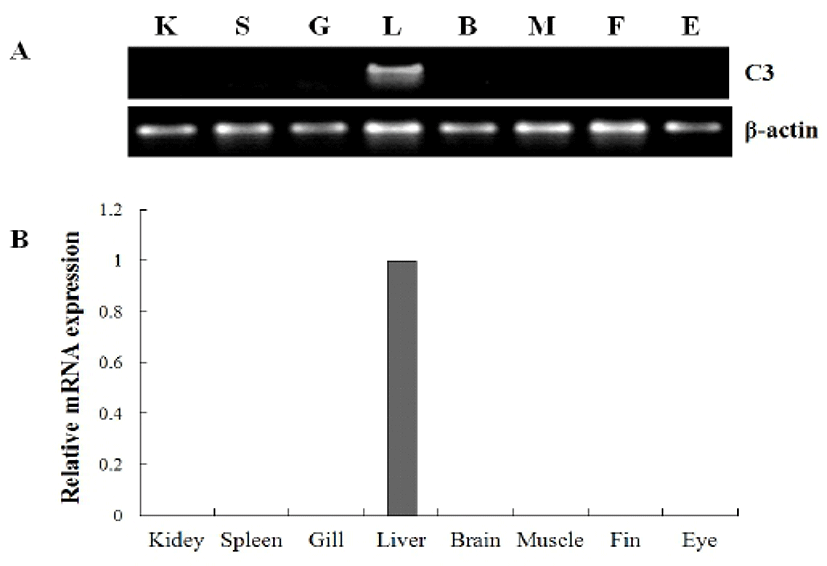
To investigate the tissue specific expression of the complement component C3 gene, oligonucleotide specific primers were designed according to previously reported C3 gene in olive flounder (GenBank accession no. AB021653), and then we examined by RT-PCR using isolated various tissues from 2-year-old healthy olive flounder. The mRNA expression level of olive flounder C3 was compared with beta-actin as the internal control in various tissue. The mRNA of olive flounder C3 gene was absolutely expressed only the liver, while other tissues (muscle, brain, eye, kidney, spleen, gill and fin) was not detected at all in healthy olive flounder (Fig. 2).

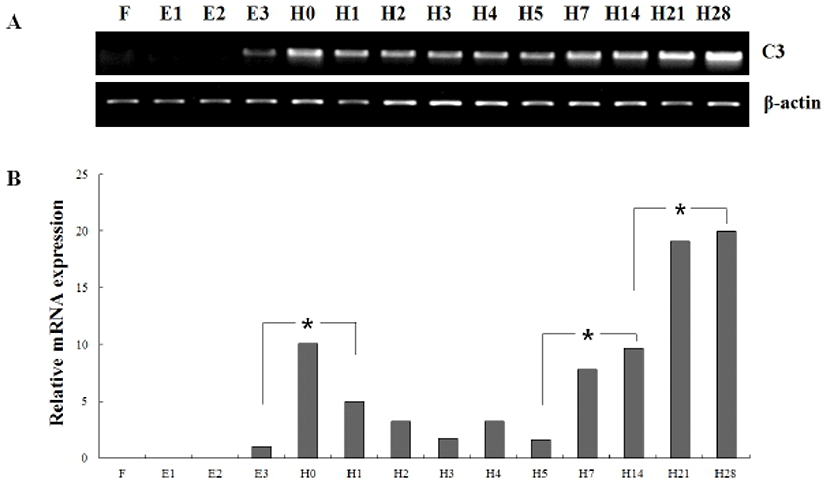
In order to investigate of olive flounder C3 mRNA expression during early development, we analyzed the temporal expression pattern of olive flounder C3 at the four embryos stages and ten larval stages (Fig. 3). As a result, the mRNA level of olive flounder C3 was not detected from fertilized egg (F) to blastula (E2). The olive flounder C3 expression was detected from late neurula (E3) and increased hatching step and then dropped. The lowered level significantly increased again to metamorphosis (H28). The intensity of C3 transcript was measured on the basis of late neurula stage (E3) (1.0-fold), each value has the hatching stage (H0, 10.1-fold), H1 (5.0-fold), H2 (3.2-fold), H3 (1.8-fold), H4 (3.2-fold), H5 (1.6-fold), H7 (7.8-fold), H14 (9.6-fold), H21 (19.1-fold) and H28 (20.0-fold), respectively.

Significant induction of olive flounder C3 expression was detected in hatching stage (H0), 7 dph (H7) and 21 dph (H21). These results showed the mRNA of olive flounder C3 gene was accumulated from hatching stage to early larvae stage until 28 dph. These expression pattern of olive flounder C3 mRNA during the early developmental stage suggest a vital role of defence mechanisms during the earliest stages of life.
DISCUSSIONS
Because of the importance of primary immune response, many studies have been conducted in fish. These reports commonly indicate that complement genes play an essential role in altering the host of the presence of potential pathogens (Boshra et al., 2006). Among complement component, C3 play a crucial function in the early immune response of fish larvae (Løvoll et al., 2007). The amino acid sequence was compared to the corresponding part of other known C3 sequences using ClustalW, shows that similarity with olive flounder (99%), Atlantic halibut (84%), miiuy croaker (80%), orange-spotted grouper (80%), yellow perch (76%), spotted wolffish (75%), gilthead sea bream (74%) and green swordtail (73%) (Fig. 1).
Researches reported that C3 is ubiquitiously expressed various organs and their presence detected throughout the early development stages of larvae in Atlantic cod (Lange et al., 2004b) and Atlatic halibut (Lange et al., 2004c). These result are conflicted with C3 expression studies in the spotted wolffish (Abelseth et al., 2003), where C3 expression appeared to be limited only the liver. In our study, we examined the tissue distribution of olive flounder C3 using various tissues from healthy olive flounder to analyze a patterns of tissues expression. As a result, olive flounder C3 mRNA was expressed only in the liver. Our results are similar with other study in olive flounder (Yazawa et al., 2005). Yazawa et al. described that C3 gene was also expressed only in the liver that stimulated with lipopolysaccharide (LPS). The liver is a important organ with innate immunity, playing a crucial role in host defenses against pathosens. But, these distribution difference may be due to configuration of the different kinds of isotypes and perhaps more C3 isoforms exist in Atlantic cod and Atlatic halibut. Thus, it will be great interest to determine the functional diversity of C3 in teleost fish species.
Fish larvae are exposed to pathogens a long period before of time until maturation of their lymphoid organs, therefore innate mechanisms may be essential for survival (Zapata et al., 1997). But, the mRNA expression analysis of C3 during the early developmental stage in olive flounder is insufficient. In our result, real-time PCR has been performed to detect the onset of C3 transcription in late neurula stage, observed the increased mostly until 28 dph. Induction of C3 mRNA was observed in hatching stage, that seems to be related with initiation a set up of immune system. Also, significant expression of C3 was detected form 7 dph to 21 dph, this time is when the development of digestive tract and feed conversion of extruded pellet (EP). These significantly differences are indicated that immune maturation system as a growth. In our study, the results showed the mRNA of C3 gene was accumulated from hatching stage to early larvae stage until 28 dph and mostly increased during developmental proceed. In other studies, it is reported that the salmon (Løvoll et al., 2007) and rainbow trout (Løvoll et al., 2006) profiles differed after hatch by increasing and deflating expression levels, respectively. Moreover C3 has been found in several different organs and tissues of developing cod (Lange et al., 2004b) and halibut (Lange et al., 2004c) using immunohistochenistry techniques. These studies suggest that complement may play a role in the generation of different organs and not only in the defence against invading pathogens (Dalmo, 2005).
In summary, this study provides the information of C3 mRNA expression during the early developmental stage in olive flounder. Expression pattern of olive flounder C3 in tissue distribution and developmental stage shows that may play an important function in the early immune response of olive flounder larvae. It is provides the first appearance of complement component C3 decribed in the present paper and indicates a relevant role of C3 during early developmental stages of olive flounder. However, the more research is needed to the isotype and exact function of C3 during the early development.

