Short Communication

Analysis of Geographical Genetic Differences of Arkshell Populations in Korea

Jong-Man Yoon1,https://orcid.org/0000-0003-2825-681X
Author Information & Copyright
1Department of Aquatic Life Medicine, College of Ocean Science and Technology, Kunsan National University, Gunsan 54150, Korea
Corresponding author Jong-Man Yoon Department of Aquatic Life Medicine, College of Ocean Science and Technology, Kunsan National University, Gunsan 54150, Korea. Tel: +82-63-469-1887 E-mail: jmyoon@kunsan.ac.kr

Copyright © 2021 The Korean Society of Developmental Biology. This is an Open Access article distributed under the terms of the Creative Commons Attribution Non-Commercial License (http://creativecommons.org/licenses/by-nc/4.0/) which permits unrestricted non-commercial use, distribution, and reproduction in any medium, provided the original work is properly cited.

Received: Mar 02, 2021 ; Revised: May 08, 2021 ; Accepted: May 29, 2021

Published Online: Jun 30, 2021

Abstract

A PCR-founded genetic analysis aim and principle was used to foster a hierarchical polar dendrogram of the Euclidean genetic distances (GDs) for two arkshell populations, Scapharca broughtonii (YEOSU, Yeosu population and JINHAE, Jinhae population). Five oligonucleotides primers were make use of to craft 354 and 390 scorable bands in the Yeosu and Jinhae populations, respectively, outspreading in DNA fragment size from 100 bp to 1,600 bp. The bandsharing (BS) results disclosed that the Jinhae population had a higher average BS value (0.700) than that for the Yeosu population (0.692). The GD between individuals supported an adjacent association in grouping II (JINHAE 12 – JINHAE 22). The observation of a noteworthy GD between the two Scapharca populations verified that this PCR-generated technique could be a profitable attempt for within- and between-population-grounded biological DNA scrutiny. The potential of PCR inquiry will be favorable in the selection of individuals and/or populations for several reproductive- and/or quarantine-connected characters in aquafarming manufacture.

Keywords: Arkshell; Euclidean genetic distances; Polar dendrogram; Scapharca broughtonii

INTRODUCTION

Arkshells are among the most popular shellfish types in Korea and are a favorite food owing to their chewy flavor and healthful worth. Scapharca broughtonii is an ecologically warm-water bivalve species, being attached to the class Bivalvia, family Arcidae, and affiliates of the genus Scapharca disseminated expansively in the southern sea, Yellow sea, and several sea areas around the Korean peninsula. The breeding seasons are from July to August. The crude cover shield of this shellfish species is blackish brown, roofed with black hair, with reddish muscle in the interior. The inner feet are long, triangular, and reddish. Like other shellfish, the growth rates of arkshells are affected pointedly by the water surroundings. Above all, there are marked differences in the figure, size, body muscle color, and shell color in S. broughtonii in accordance with the environmental conditions of the habitat, such as feed availability, water quality, and various inhabitation conditions.

Nevertheless, there have been few genetic and molecular-biological surveys of these kinds of Korean bivalves, which are appreciated as notable environmentally (Kim et al., 2007; Lee et al., 2020), reproductively (Rha et al., 2010), and nutritionally (Kim et al., 2000; Kang et al., 2020) compared to other shellfish species. Therefore, it is essential to comprehend the genetic characteristics and structure of this bivalve to assess the patent genetic effects truthfully. Differences in such traits reflect the species-distinct origin and its genetic identity (Chenyambuga et al., 2004). Numerous features of shellfish (Scapharca broughtonii) meditate their preferred seawater habitat, such as rocks, bottom, and water supremacy.

Polymerase chain reaction (PCR)-based molecular analyses have been used to explore the genetic characteristics of various fish and crustacean species (Callejas & Ochando, 1998; Liu et al., 1998; Mamuris et al., 1999; Huang et al., 2000; Yoon & Kim, 2003; Kim et al., 2004; Kim et al., 2006; Oh & Yoon, 2014; Jeon & Yoon, 2015; Yoon, 2018). Markers peculiar to a geographical population, breed, species, or genus have been applied to individuals or groups to define the genetic status, assess their hybrid parentage, or appraise the usefulness of DNA markers. To begin with, cluster scrutiny of samples of arkshell acquired in the Yeosu and Jinhae city of Korea were executed to explicate the Euclidean genetic distances (GDs) between two arkshell populations.

MATERIALS AND METHODS

The extraction of genomic DNA was put into effect under conditions as previously described ( Jeon & Yoon, 2015). Before extracting the DNA, muscle samples were acquired from 11 individual arkshells of Yeosu and Jinhae, respectively, in the Korean peninsula. The samples were centrifuged at 19,621×g for 5 min to extract the DNA from the lysate. The concentration of extracted genomic DNA was estimated based on the absorbance at 260 nm using a spectrophotometer (Beckman Coulter, Buckinghamshire, UK). The DNA balls were then incubation-dried overnight at 2°C, held at −79°C, and melted in distilled water when needed.

PCR amplification was implemented in keeping with the experiment procedures by Yoon (2018). The following oligonucleotide primers (Operon Technologies, Alameda, CA, USA) were used: OPA-20 (5’-GTTGCGATCC-3’), OPD-07 (5’-TTGGCACGGG-3’), OPD-16 (5’-AGGGCGTAAG-3’), OPD-19 (5’-CTGGGGACTT-3’), and OPD-20 (5’-ACCCGGTCAC-3’). The amplification products were separated by electrophoresis in 1.4% agarose gels with TBE and using a 100 bp DNA ladder (Bioneer Co., DaeJeon, Korea) as the DNA molecular weight marker. After electrophoresis, gels were stained with ethidium bromide, illuminated with ultraviolet ray (Oh & Yoon, 2014).

The bandsharing (BS) value was gaged by the presence/absence of amplified products at the specific positions in the same gel. These oligonucleotide primers allowed the production of BS values and a calculation of the GDs of the two arkshell bivalve populations sampled. The average of within-population similarity matrix was estimated by pairwise comparison between individuals within a population (Yoke-Kqueen & Radu, 2006). Euclidean GDs were appraised within and between populations using the hierarchical clustering program Systat version 10 (SPSS, Chicago, IL, USA).

RESULTS AND DISCUSSION

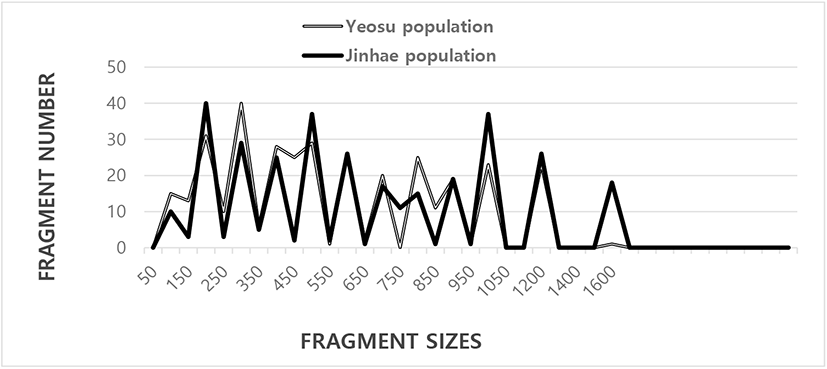
Three hundred and fifty-four and 390 DNA scorable fragments, 100 bp to 1,600 bp in size, were generated from five oligonucleotide primers for the Yeosu and Jinhae arkshell populations, respectively (Fig. 1). Zhou et al. (2000) constructed a phylogenetic tree using the unweighted pair group method (UPGMA), and 3,744 fragments in the gynogenetic clones from the silver crucian carp, Carassius auratus gibelio Block, were assessed using the arithmetic mean (UPGMA) cluster analysis method. The fragments in the bastard halibut (Paralichthys olivaceus) were acquired using four primers ranging in size from approximately 100 bp to less than 2,000 bp (Yoon, 2018). The sizes of DNA fragments obtained using random amplifications of a polymorphic DNA (RAPD) PCR-based method have been used to genetically profile the following species: blue catfish (Ictalurus furcatus) (Liu et al., 1998), blacklip abalone (Haliotis rubra) (Huang et al., 2000), oyster (Crassostrea spp.) (Kim et al., 2004), bullhead (Pseudobagrus fulvidraco) (Yoon & Kim, 2004), and populations of the eel-loach (Pangio spp.) (Siti Azizah et al., 2005). Specific primers are useful for identifying individuals based on an examination of different DNA polymorphisms (Bartish et al., 2000; Yoon & Kim, 2004; Kim et al., 2006; Oh & Yoon, 2014).
dr-25-2-105-g1
Fig. 1. Distribution of fragment sizes of Yeosu and Jinhae arkshell populations from the Korean peninsula. Solid grey lines: Yeosu population A (YEOSU01, 02, 03, 04, 05, 06, 07, 08, 09, 10, and 11). Solid black lines: Jinhae population B (JINHAE 12, 13, 14, 15, 16, 17, 18, 19, 20, 21, and 22). The fragment numbers in each size interval have been computed from the integrated fragments obtained with every five oligonucleotide primers. The higher fragment sizes (>1,600 bp) are observed in the Jinhae arkshell population.
Download Original Figure

This study determined the BS values based on the existence or nonexistence of distinct fragments that used to evaluate the similarity between the samples of two arkshell populations (Table 1). The banding patterns diverged abnormally among the oligonucleotide primers from the two-arkshell population samples. The average BS values of the Yeosu and Jinhae population samples was used to determine the similarity matrix, which ranged from 0.590 to 0.862 and 0.547 to 0.893, respectively. The BS value between the individual Jinhae population sample numbers 18 and 19 was 0.893, the highest value between the two-arkshell populations sampled.

The 33 unique loci shared by each population in the Yeosu arkshell sample were generated using the OPD-20 oligonucleotides primer, approximately 200 bp, 500 bp, and 700 bp in size (Table 2). The oligonucleotide primer OPD-20 produced 55 unique loci (approximately 200 bp, 500 bp, and 700 bp in size) that were shared with each species in the Jinhae arkshell sample. Surprisingly, the primer OPD-20 generated 88 unique loci (approximately 200 bp, 300 bp, 500 bp, 600 bp, 750 bp, 800 bp, 1,200 bp, and 1,600 bp in size) that were shared with each species of Jinhae arkshell that could be used to classify each population. On the other hand, the OPD-07 primer also detected 22 loci shared by the two-arkshell populations. Those major and minor fragments were approximately 800 bp in size and comparable in all populations sampled from both populations (Table 2). The primer BION-80 detected 7 shared loci by the three venerid clam species, major and/or minor fragments of sizes 500 bp, which were matching in all samples ( Jeon & Yoon, 2015).

In the present study, the average BS value for individuals in the Jinhae arkshell samples was higher (0.700) than those in the Yeosu arkshell samples (0.692) (Table 3). The average BS values were similar to those of the Cyclina sinensis species (0.754) ( Jeon & Yoon, 2015). The BS values of the two-arkshell bivalve populations were also similar to those reported previously. The average bandsharing values in the bastard halibut (Paralichthys olivaceus) populations were 0.810±0.009 in individuals from Hampyeong population and 0.877±0.007 in individuals from Wando population, respectively (Yoon, 2018). These results were similar to those reported elsewhere: 0.802±0.010 and 0.711±0.008 for the Jeonju crayfish (JJC) and the Jeongup crayfish (JUC) populations, respectively (Kim et al., 2006). Nevertheless, the average BS value recorded in this study was higher than that reported for two oyster populations (0.282±0.008) (Kim et al., 2004).

Table 1. Trigonal similarity matrix, plus the bandsharing values, evaluated using the Nei and Li's index of the similarity of Yeosu and Jinhae arkshell populations from the Korean peninsula, respectively
Bandsharing values of Yeosu arkshell population Bandsharing values of Jinhae arkshell population
1 2 3 4 5 6 7 8 9 10 11 12 13 14 15 16 17 18 19 20 21 22
1 - 0.723 0.747 0.752 0.640 0.683 0.786 0.629 0.602 0.663 0.617 0.630 0.540 0.538 0.579 0.561 0.530 0.514 0.518 0.529 0.475 0.426
2 - 0.668 0.628 0.679 0.653 0.693 0.685 0.713 0.655 0.665 0.502 0.454 0.515 0.410 0.498 0.506 0.490 0.487 0.499 0.461 0.391
3 - 0.763 0.765 0.705 0.677 0.740 0.594 0.656 0.590 0.654 0.546 0.571 0.616 0.554 0.563 0.550 0.573 0.537 0.472 0.463
4 - 0.788 0.748 0.862 0.698 0.677 0.670 0.606 0.648 0.577 0.671 0.604 0.630 0.643 0.521 0.667 0.581 0.554 0.460
5 - 0.716 0.682 0.764 0.656 0.692 0.590 0.505 0.436 0.512 0.608 0.599 0.586 0.478 0.591 0.529 0.484 0.416
6 - 0.707 0.641 0.664 0.748 0.654 0.671 0.602 0.548 0.596 0.546 0.459 0.444 0.541 0.589 0.447 0.405
7 - 0.710 0.691 0.827 0.653 0.573 0.545 0.570 0.543 0.604 0.585 0.539 0.613 0.608 0.532 0.475
8 - 0.752 0.610 0.678 0.528 0.461 0.463 0.484 0.556 0.559 0.648 0.564 0.572 0.568 0.487
9 - 0.832 0.716 0.451 0.526 0.458 0.481 0.534 0.401 0.308 0.440 0.423 0.560 0.377
10 - 0.652 0.498 0.510 0.601 0.590 0.594 0.436 0.327 0.388 0.536 0.515 0.439
11 - 0.443 0.431 0.414 0.316 0.391 0.412 0.441 0.362 0.453 0.474 0.359
12 - 0.843 0.717 0.784 0.761 0.790 0.686 0.844 0.653 0.798 0.735
13 - 0.788 0.741 0.634 0.729 0.547 0.702 0.603 0.624 0.718
14 - 0.727 0.724 0.737 0.637 0.672 0.662 0.649 0.597
15 - 0.741 0.758 0.598 0.762 0.663 0.673 0.690
16 - 0.697 0.732 0.674 0.672 0.651 0.599
17 - 0.703 0.893 0.627 0.760 0.662
18 - 0.644 0.726 0.721 0.598
19 - 0.658 0.728 0.692
20 - 0.669 0.717
21 - 0.695
22 -
Download Excel Table
Table 2. Number of unique loci shared to each population and the number of loci shared by the two arkshell populations generated by DNA analysis using five oligonucleotides primers in Yeosu and Jinhae populations from the Korean peninsula
Primer No. of unique loci shared to each population No. of loci shared by the two arkshell populations
Yeosu population Jinhae population Two arkshell population
OPA-20 22 11 22
OPD-07 22 88 22
OPD-16 0 22 0
OPD-19 0 11 0
OPD-20 33 33 66
Total no. 77 165 110
Average no. per primer 15.4 33.0 22.0
Download Excel Table
Table 3. Multiple schemes of average bandsharing values (mean±SE) between Yeosu and Jinhae arkshell populations from the Korean peninsula were formed consistent with the bandsharing values and similarity matrix
Population YEOSU JINHAE
YEOSU 0.692±0.008a 0.515±0.007b
JINHAE - 0.700±0.009a

a,b Values with different superscript are significantly different, p<0.05.

Each value is a result of three different experiments.

YEOSU, Yeosu population; JINHAE, Jinhae population.

Download Excel Table

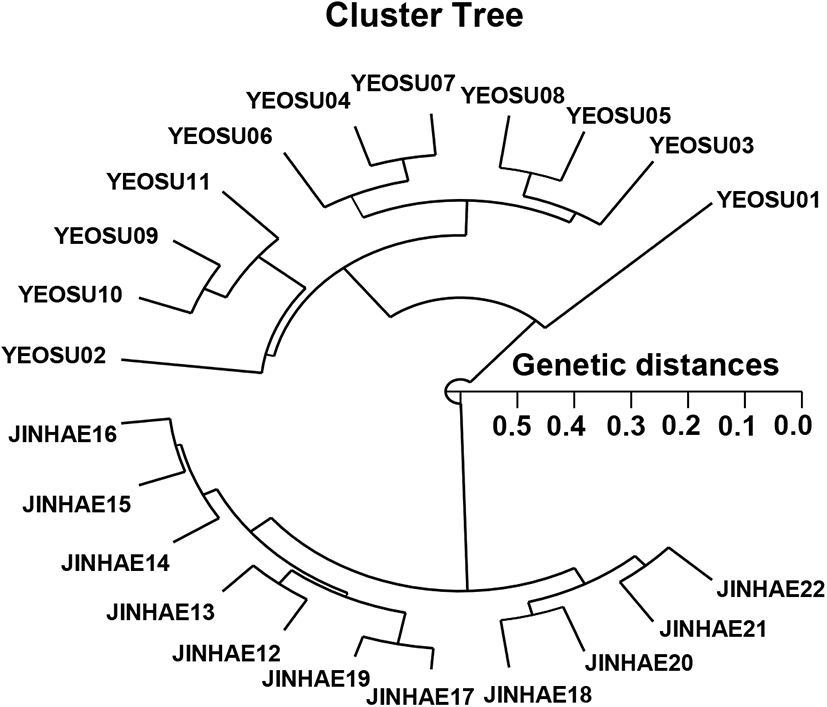
The hierarchical polar dendrogram taken using five oligonucleotide primers yielded two genetic clusters: group I (YEOSU 01, 02, 03, 04, 05, 06, 07, 08, 09, 10, and 11) and group II ( JINHAE 12, 13, 14, 15, 16, 17, 18, 19, 20, 21, and 22) (Fig. 2). Within the twenty-two shellfish sampled, which exhibited considerable molecular differences, the individual fish no. 19 and 17 from group I (GD=0.045) showed the shortest GD. In contrast, shellfish no. 01 and 20 (GD=0.574) showed the longest GD among the twenty-two individuals that demonstrated meaningful molecular differences. The polar dendrogram of the Euclidean GDs showed that the individuals in groups I and II were distantly related (Fig. 2). Hence, there may be individual affiliations in group I. The Euclidean GDs between two populations of bastard halibut (Paralichthys olivaceus) were determined to be 0.018–0.489 from the pooled data for the eight primers used (Yoon, 2018). This technique might help define the diagnostic markers related to the breed, species, genus, and geographic population identification in finfish and crustaceans (Smith et al., 1997; Klinbunga et al., 2000; McCormack et al., 2000; Yoon & Park, 2002; Yoon & Kim, 2004; Park et al., 2005; Siti Azizah et al., 2005), plant (Bartish et al., 2000; Nozaki et al., 2000) and cattle (Suprabha et al., 2005). PCR-based analysis can determine the genetic characteristics of individuals and populations, as highlighted by the substantial GD observed between the two Scapharca populations. The survey data of the genetic variations between arkshell populations provides important statistical information for the fish husbandry. Nevertheless, specific genetic markers will be needed to characterize different populations or individuals of the genus Scapharca according to geography, relate these characteristics with the morphological features, and clarify any vagueness among genera and geographical populations. Additional sampling locations will be required to describe more accurately the area where phylogeographic disorders come about in Scapharca.
dr-25-2-105-g2
Fig. 2. Hierarchical polar dendrogram and genetic distances of arkshell attained from Yeosu population (YEOSU) and Jinhae (JINHAE) population. The connexion between different individuals of YEOSU and JINHAE population from cluster I (YEOSU 01, 02, 03, 04, 05, 06, 07, 08, 09, 10, and 11) and cluster II (JINHAE 12, 13, 14, 15, 16, 17, 18, 19, 20, 21, and 22) created in keeping with the bandsharing values and similarity matrix.
Download Original Figure

Conflict of interests

The author declares no potential conflict of interest.

Acknowledgements

Not applicable.

Authors’ contributions

The article is prepared by a single author.

Ethics approval

This article does not require IRB/IACUC approval because there are no human and animal participants.

REFERENCES

1.

Bartish IV, Garkava LP, Rumpunen K, Nybom H. 2000; Phylogenetic relationships and differentiation among and within populations of Chaenomeles Lindl. (Rosaceae) estimated with RAPDs and isozymes. Theor Appl Genet. 101 p. 554-563

2.

Callejas C, Ochando MD. 1998; Identification of Spanish barbel species using the RAPD technique. J Fish Biol. 53 p. 208-215

3.

Chenyambuga SW, Hanotte O, Hirbo J, Watts PC, Kemp SJ, Kifaro GC, Gwakisa PS, Petersen PH, Rege JEO. 2004; Genetic characterization of indigenous goats of sub-Saharan Africa using microsatellite DNA markers. Asian-Australas J Anim Sci. 17 p. 445-452

4.

Huang BX, Peakall R, Hanna PJ. 2000; Analysis of genetic structure of blacklip abalone (Haliotis rubra) populations using RAPD, minisatellite and microsatellite markers.. Mar Biol. 136 p. 207-216

5.

Jeon JH, Yoon JM. 2015; Genetic distances of three venerid species identified by PCR analysis.. Korean J Malacol. 31 p. 257-262

6.

Kang SI, Yoon IS, Choi KS, Kim JS, Lee JS, Heu MS, Kim JS. 2020; Sensory and nutritional characteristics of seasoned broughton’s ribbed ark Scapharca broughtonii product. Korean J Fish Aquat Sci. 53 p. 342-350.

7.

Kim JB, Lee SY, Jung CG, Jung CS, Son SG. 2007; The effects of the spat planting time and environmental factors in the arkshell, Scapharca broughtonii Schrenck culture.. J Aquacult. 20 p. 31-40.

8.

Kim JY, Park CY, Yoon JM. 2004; Genetic differences and DNA polymorphism in oyster (Crassostrea spp.) analysed by RAPD-PCR. Korean J Genet. 26 p. 123-134.

9.

Kim S, Kim YH, Yoon JM. 2006; Genetic variation in geographic crayfish (Cambaroides similis) populations. J Fish Pathol. 19 p. 141-153.

10.

Kim SD, Kim MK, Kang MS, Lee YG, Kim DS. 2000; Effects of ark shell powder on the fermentation and quality of Kimchi. Food Sci Biotechnol. 9 p. 280-284.

11.

Klinbunga S, Ampayup P, Tassanakajon A, Jarayabhand P, Yoosukh W. 2000; Development of species-specific markers of the tropical oyster (Crassostrea belcheri) in Thailand. Mar Biotechnol. 2 p. 476-484

12.

Lee HC, Jo AH, Kang JY, Park EJ, Park MJ, Kim JB. 2020; Qualitative and quantitative evaluation of residual microplastics in ark shell. Korean J Food Preserv. 27 p. 416-421

13.

Liu Z, Li P, Argue BJ, Dunham RA. 1998; Inheritance of RAPD markers in channel catfish (Ictalurus punctatus), blue catfish (I. Furcatus) and their F1, F2 and backcross hybrids. Anim Genet. 29 p. 58-62

14.

Mamuris Z, Stamatis C, Bani M, Triantaphyllidis C. 1999; Taxonomic relationships between four species of the Mullidae family revealed by three genetic methods: Allozymes, random amplified polymorphic DNA and mitochondrial DNA. J Fish Biol. 55 p. 572-587

15.

McCormack GP, Powell R, Keegan BF. 2000; Comparative analysis of two populations of the brittle star Amphiura f iliformis (Echinodermata: Ophiuroidae) with different life history strategies using RAPD markers. Mar Biotechnol. 2 p. 100-106

16.

Nozaki T, Mishiba K, Mii M, Koba T. 2000; Construction of synteny groups od Brassica alboglabra by RAPD markers and detection of chromosome aberrations and distorted transmission under the genetic background of B. campestris.. Theor Appl Genet. 101 p. 538-546

17.

Oh H, Yoon JM. 2014; Genetic distances of three mollusk species investigated by PCR analysis. Dev Reprod. 18 p. 43-49

18.

Park SY, Park JS, Yoon JM. 2005; Genetic differences and variations in slipper lobster (Ibacus ciliatus) and deep sea lobster (Puerulus sewelli) determined by RAPD analysis. Korean J Genet. 25 p. 307-317.

19.

Rha SJ, Han KH, Choi MR, Kho KH. 2010; Cryopreservation of Scapharca broughtonii (Schrenck) sperm. Korean J Malacol. 26 p. 255-260.

20.

Siti Azizah MN, Ruzainah A, Patimah I. 2005; Development of RAPD markers in the eel-loach (Pangio spp.) for genetic discrimination and monitoring of wild and cultured populations. World Aquacult. 36 p. 37-43.

21.

Smith PJ, Benson PG, McVeagh SM. 1997; A comparison of three genetic methods used for stock discrimination of orange roughy, Hoplostethus atlanticus: Allozymes, mitochondrial DNA, and random amplified polymorphic DNA. Fish Bull. 95 p. 800-811.

22.

Suprabha P, Anilkumar K, Aravindakshan TV, Raghunandanan KV. 2005; Assessment of bandsharing values in RAPD-PCR analysis of dwarf cattle of Kerala. Asian-Australas J Anim Sci. 18 p. 1217-1220

23.

Yoon JM. 2018; Genetic distances of Paralichthys olivaceus populations investigated by PCR. Dev Reprod. 22 p. 283-288

24.

Yoon JM, Kim JY. 2004; Genetic differences within and between populations of Korean catfish (S. asotus) and bullhead (P. fulvidraco) analysed by RAPD-PCR. Asian-Australas J Anim Sci. 17 p. 1053-1061

25.

Yoon JM, Kim YH. 2003; Wide marsh clam (Corbicula spp.) populations from three sites analysed by RAPD-PCR-AGE. Bull Electrochem. 19 p. 337-348.

26.

Yoon JM, Park HY. 2002; Genetic similarity and variation in the cultured and wild crucian carp (Carassius carassius) estimated with random amplified polymorphic DNA. Asian-Australas J Anim Sci. 15 p. 470-476

27.

Yoke-Kqueen C, Radu S. 2006; Random amplified polymorphic DNA analysis of genetically modified organisms. J Biotechnol. 127 p. 161-166

28.

Zhou L, Wang Y, Gui JF. 2000; Analysis of genetic heterogeneity among five gynogenetic clones of silver crucian carp, Carassius auratus gibelio bloch, based on detection of RAPD molecular markers. Cytogenet Cell Genet. 88 p. 133-139