INTRODUCTION
Breast cancer is one of the most frequently diagnosed malignancies worldwide. Although advances in detection and systemic treatment have improved clinical outcomes, recurrence and metastatic spread remain major causes of breast cancer-associated mortality (Sung et al., 2021). These clinical challenges have encouraged continued investigation of cellular programs that support tumor persistence and dissemination.
Cancer stem cells (CSCs) are operationally defined by properties such as self-renewal and the capacity to regenerate heterogeneous tumor cell populations. In breast cancer, CD44 and aldehyde dehydrogenase 1 (ALDH1) are commonly used CSC-associated markers, and sphere-forming assays are frequently used to assess sphere-forming capacity under serum-free conditions (Al-Hajj et al., 2003; Ginestier et al., 2007). CSC-like states have also been associated with treatment resistance and tumor recurrence (Reya et al., 2001; Dean et al., 2005).
Epithelial-mesenchymal transition (EMT) is a reversible cellular program characterized by changes in cell adhesion, polarity, and motility. In carcinoma models, EMT-associated changes often include reduced epithelial marker expression and increased mesenchymal markers and transcription factors such as Snail, Slug, Twist, and ZEB1 (Thiery et al., 2009; Nieto et al., 2016). EMT-associated programs can overlap with CSC-like phenotypes, although the relationship is context dependent and cannot be inferred from marker expression alone (Mani et al., 2008; Morel et al., 2008).
Catenin alpha-like 1 (CTNNAL1), also known as alpha-catulin, is an adhesion+ and cytoskeleton-associated protein related to the catenin family. Catenin-associated proteins participate in the organization of cell-cell junctions and actin networks, processes that influence cellular morphology and motility (Drees et al., 2005; Shapiro & Weis, 2009). A previous study reported that CTNNAL1 silencing altered CSC-associated markers, sphere formation, EMT-associated markers, migration, and invasion in lung cancer and glioblastoma cells (Kahm et al., 2023). However, whether CTNNAL1 is associated with these phenotypes in breast cancer cells has not been examined in detail.
In this study, we used MDA-MB-231 breast cancer cells to examine CTNNAL1 expression under sphere-forming conditions and to evaluate the effects of small interfering RNA (siRNA)-mediated CTNNAL1 knockdown on CSC-associated markers, sphere formation, EMT-associated markers, migration, and invasion.
MATERIALS AND METHODS
The human breast cancer cell line MDA-MB-231 (HTB-26; American Type Culture Collection, Manassas, VA, USA) was used in this study. MDA-MB-231 cells are commonly classified as a mesenchymal-like triple-negative breast cancer cell line. Cells were maintained in high-glucose Dulbecco’s modified Eagle’s medium (DMEM; LM001-05, Welgene, Gyeongsan, Korea) supplemented with 10% fetal bovine serum (FBS; 16000-044, Gibco, Thermo Fisher Scientific, Waltham, MA, USA) and 1% penicillin-streptomycin (SV30010, HyClone, Cytiva, Marlborough, MA, USA). Cells were cultured at 37°C in a humidified incubator containing 5% CO2.
Primary antibodies used for western blot analysis were obtained from the following sources: Santa Cruz Biotechnology (Dallas, TX, USA): ALDH1A1 (sc-374149), β-actin (sc-47778), CD44 (sc-9960), Slug (sc-166476), Snail (sc-271977), Sox2 (sc-369823), Twist (sc-81417), vimentin (sc-6260), and ZEB1 (sc-25388); Abcam (Cambridge, UK): ALDH1A3 (ab129815) and Oct4 (ab181557); Cell Signaling Technology (Danvers, MA, USA): Nanog (4893S) and N-cadherin (13116); Novus Biologicals (Centennial, CO, USA): CTNNAL1 (NBP1-33341); and BD Biosciences (San Jose, CA, USA): E-cadherin (610182). Horseradish peroxidase-conjugated anti-mouse (7076S) and anti-rabbit (7074S) secondary antibodies were obtained from Cell Signaling Technology.
Total RNA was extracted using TRI Reagent (TR118, Molecular Research Center, Cincinnati, OH, USA) according to the manufacturer’s instructions. RNA concentration was measured using a NanoDrop ND-1000 spectrophotometer (Thermo Fisher Scientific). One microgram of total RNA was reverse transcribed using RT Premix (25082, LiliF Diagnostics, Seongnam, Korea). Polymerase chain reaction (PCR) amplification was performed using PCR PreMix (25265, LiliF Diagnostics) with an Eppendorf Mastercycler (Eppendorf, Hamburg, Germany).
PCR amplification was performed with an initial denaturation at 95°C for 2 min, followed by gene-specific amplification cycles consisting of denaturation at 94°C for 1 min, annealing for 1 min, and extension at 72°C for 1 min. The annealing temperatures and cycle numbers were as follows: CD44, 54°C for 32 cycles; ALDH1A1, 48°C for 34 cycles; ALDH1A3, 49°C for 34 cycles; CTNNAL1, 54°C for 32 cycles; and GAPDH, 54°C for 32 cycles. A final extension was performed at 72°C for 5 min.
The primer sequences were as follows: CTNNAL1, forward 5′-CCATGCTGATCATGTGGTTC-3′ and reverse 5′-GTTGGCCAGTCACCTGAAAT-3′; ALDH1A1, forward 5′-TTAGCAGGCTGCATCAAAA-3′ and reverse 5′-GCACTGGTCCAAAAATCTCC-3′; ALDH1A3, forward 5′-ACCTGGAGGGCTGTATTAGA-3′ and reverse 5′-GGTTGAAGAACACTCCCTGA-3′; CD44, forward 5′-TCCTCACATCCAACACCTCC-3′ and reverse 5′-GCTGCTCACGTCATCATCAG-3′; and GAPDH, forward 5′-AGTCAACGGATTTGGTCGTA-3′ and reverse 5′-GTCATGAGTCCTTCCACGAT-3′.
PCR products were separated on 2% agarose gels (50153, Lonza, Rockland, ME, USA) prepared in TAE buffer (IBSD-BT002, iNtRON Biotechnology, Seongnam, Korea) and visualized using a UUV-01 UltraSlim imaging system (Maestrogen, Hsinchu, Taiwan).
Cells were lysed in RIPA buffer (R4100-050, GenDEPOT, Katy, TX, USA) supplemented with a protease inhibitor cocktail (78542300, Sigma-Aldrich, Darmstadt, Germany). Protein concentrations were determined using a Bradford protein assay kit (5000006, Bio-Rad, Hercules, CA, USA). Forty micrograms of total protein per sample were separated by 8%–12% sodium dodecyl sulfate-polyacrylamide gel electrophoresis and transferred to 0.2-μm nitrocellulose membranes (10600001, Cytiva). Membranes were blocked with skim milk (SKI500, LPS Solution) for 1 h at room temperature and subsequently incubated with primary antibodies overnight at 4°C.
Primary antibodies were diluted as follows: CD44, 1:500; ALDH1A1, 1:1,500; ALDH1A3, 1:1,500; Oct4, 1:1,000; Sox2, 1:1,000; Nanog, 1:500; E-cadherin, 1:1,000; N-cadherin, 1:1,000; vimentin, 1:1,000; Snail, 1:1,000; Slug, 1:1,000; Twist, 1:1,000; ZEB1, 1:500; CTNNAL1, 1:1,000; and β-actin, 1:1,000. Membranes were then incubated with horseradish peroxidase-conjugated secondary antibodies for 1 h at room temperature. Secondary antibodies were diluted 1:10,000, except those used for CD44 and Nanog, which were diluted 1:5,000. Protein bands were detected using enhanced chemiluminescence reagents and a KwiKQuant Pro imaging system (D1010).
Band intensities from western blot and reverse transcription-PCR images were quantified using ImageJ software (National Institutes of Health, Bethesda, MD, USA). Protein and mRNA signals were normalized to β-actin and GAPDH, respectively. For graphical presentation, the normalized value of the corresponding control group was set to 1.0, and experimental values were expressed relative to that control. Quantitative data were obtained from three independent experiments (n=3).
Two independent CTNNAL1-targeting siRNAs were used to reduce CTNNAL1 expression. CTNNAL1 siRNA #1 (Bioneer, Daejeon, Korea) had the following sequence: sense, 5′-CAGACAAAACAGGAGUGAU-3′; antisense, 5′-AUCACUCCUGUUUUGUCUG-3′. CTNNAL1 siRNA #2 (sc-92652) and control siRNA (sc-37007) were obtained from Santa Cruz Biotechnology. Cells were transfected with CTNNAL1-targeting or control siRNA at a final concentration of 15 nM using Lipofectamine RNAiMAX Transfection Reagent (13778150, Thermo Fisher Scientific) according to the manufacturer’s instructions. Cells were incubated for at least 48 h before subsequent analyses.
For sphere formation, 1×10⁶ cells were seeded in 100-mm cell culture dishes (F20100, SPL Life Science), with one dish used per condition in each independent experiment. Cells were cultured in serum-free DMEM/F12 medium (1:1; 11320-033, Gibco, Thermo Fisher Scientific) supplemented with B27 (17504-044, Gibco), N-2 (17502-048, Gibco), epidermal growth factor (20 ng/mL; E9644, Sigma-Aldrich), and basic fibroblast growth factor (20 ng/mL; 13256-029, Thermo Fisher Scientific). Cells were maintained under sphere-forming conditions for 10 days, and only primary sphere formation was evaluated.
Images were acquired from 10 randomly selected fields per dish. Cellular structures with a diameter of ≥40 μm after 10 days of culture were included in the analysis. Sphere diameter was quantified in pixels using ImageJ. Within each independent experiment, sphere diameter measurements from the 10 fields were averaged to obtain a single mean value for each experimental condition. For graphical presentation, the mean sphere diameter of the si-Control group in each independent experiment was set to 1.0, and the corresponding mean value of the si-CTNNAL1 group was expressed relative to its matched control. Three independent experiments were performed (n=3).
Cells were seeded by limiting dilution into 96-well plates (701003, NEST Biotechnology, Wuxi, China) at one to two cells per well. Following seeding, wells were examined under an inverted phase-contrast microscope, and only wells confirmed to contain exactly one cell were included in the analysis. Forty single-cell wells per condition were monitored in each experiment. Cells were cultured in sphere-forming medium for 14 days. An aggregate containing ≥5 cells was considered sphere-forming for this assay. Sphere-forming efficiency was calculated as the percentage of monitored single cells that generated a sphere. Three independent experiments were performed (n=3).
Migration and invasion were assessed using Transwell chambers with 8-μm pores (3422, Corning, Corning, NY, USA). For invasion assays, the inserts were precoated with Matrigel (356234, Corning) diluted 1:10. Cells (1.5×10⁴ cells/well) suspended in serum-free Opti-MEM (11058-021, Gibco, Thermo Fisher Scientific) were added to the upper chamber, and medium containing 10% FBS was added to the lower chamber. After 24 h, migrated or invaded cells were fixed with 70% ethanol for 2 min and stained with 2.3% crystal violet (HT90132, Sigma-Aldrich) for 1 min. Stained cells were examined under a light microscope at ×100 magnification. Cells were counted in three randomly selected fields per insert, and the field-level counts were averaged for each experiment. Three independent experiments were performed (n=3).
Cell viability following CTNNAL1 knockdown was assessed using a Cell Counting Kit-8 (CCK-8; CK04, Dojindo Laboratories, Kumamoto, Japan). Cells were seeded in 96-well plates (701003, NEST Biotechnology) at 1×10⁵ cells per well and transfected with control or CTNNAL1-targeting siRNAs. At 48 h after siRNA treatment, 10 μL of CCK-8 reagent was added to each well and incubated for 1 h. Absorbance was measured at 450 nm. Three technical replicates were included for each condition, and three independent experiments were performed (n=3).
Data are presented as mean±SD from three independent experiments (n=3), unless otherwise indicated. Technical measurements obtained within the same independent experiment were not treated as independent biological replicates. For sphere formation assays, measurements obtained from randomly selected fields within each experiment were summarized to generate one value per condition for each independent experiment. Similarly, for Transwell migration and invasion assays, cell counts from three randomly selected fields per insert were averaged before statistical analysis. Comparisons between two groups were performed using a paired two-tailed Student’s t-test because control and experimental conditions were evaluated in parallel within each independent experiment. Comparisons among three matched groups were performed using repeated-measures one-way ANOVA followed by Dunnett’s multiple-comparisons test when individual treatment groups were compared with the control group. A p-value<0.05 was considered statistically significant. The statistical tests and significance thresholds used for individual analyses are indicated in the corresponding figure legends.
RESULTS
To examine whether CTNNAL1 expression is associated with sphere-forming culture, CTNNAL1 and CSC-associated markers were compared between adherent and sphere-forming MDA-MB-231 cells. Western blot analysis showed that CD44, ALDH1A1, ALDH1A3, and CTNNAL1 protein levels were higher under sphere-forming conditions than under adherent conditions (Fig. 1A).
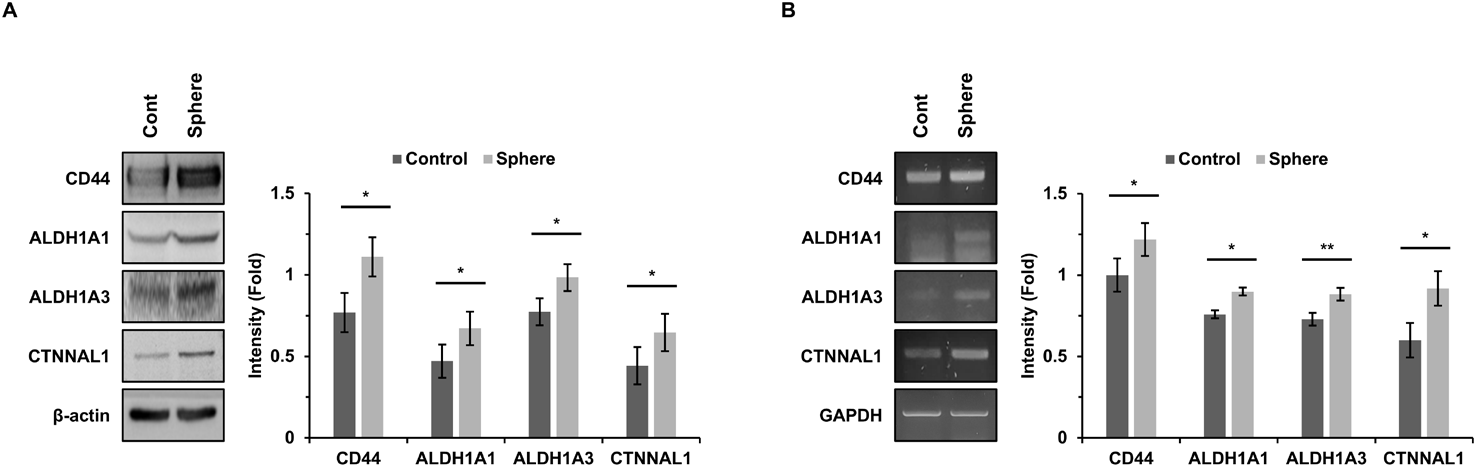
Reverse transcription-PCR analysis showed a similar pattern at the mRNA level: CD44, ALDH1A1, ALDH1A3, and CTNNAL1 transcripts increased in sphere-forming cells, whereas GAPDH remained unchanged (Fig. 1B). These data show that CTNNAL1 expression increases in parallel with CSC-associated markers under the sphere-forming conditions used in this study.
To examine whether CTNNAL1 is associated with CSC-related phenotypes, MDA-MB-231 cells were transfected with CTNNAL1-targeting siRNA. CTNNAL1 protein expression was significantly reduced compared with control siRNA-transfected cells. CTNNAL1 depletion was accompanied by reduced expression of CD44, ALDH1A1, and ALDH1A3 (Fig. 2A).
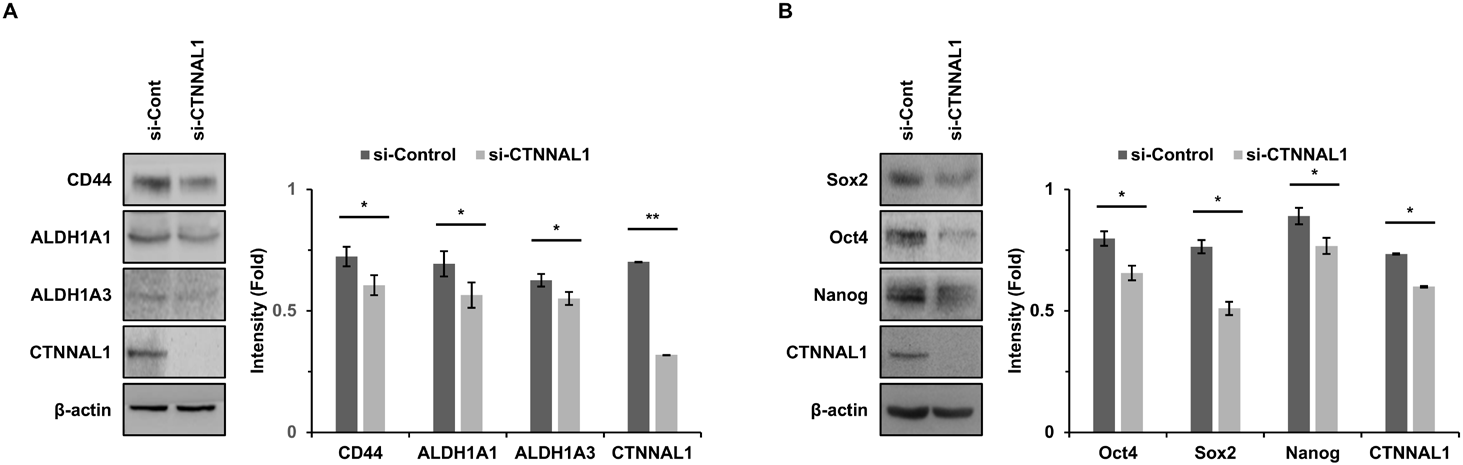
The expression of the stemness-associated transcription factors Sox2, Oct4, and Nanog also decreased following CTNNAL1 knockdown (Fig. 2B). To further assess whether the observed changes were reproducible with an independent CTNNAL1-targeting siRNA, selected markers were examined using a second siRNA. Both CTNNAL1-targeting siRNAs reduced CTNNAL1 expression and showed similar decreases in ALDH1A1 and ALDH1A3 expression (Supplementary Fig. 1A). These observations indicate that CTNNAL1 depletion is associated with reduced expression of multiple CSC-associated proteins in MDA-MB-231 cells.
Sphere formation assays were performed to assess sphere-forming capacity following CTNNAL1 depletion. Compared with control siRNA-transfected cells, CTNNAL1-depleted cells showed a reduction in sphere diameter (Fig. 3A). Sphere diameter measurements obtained within each independent experiment were averaged, and the independent experiment was used as the unit of statistical analysis.
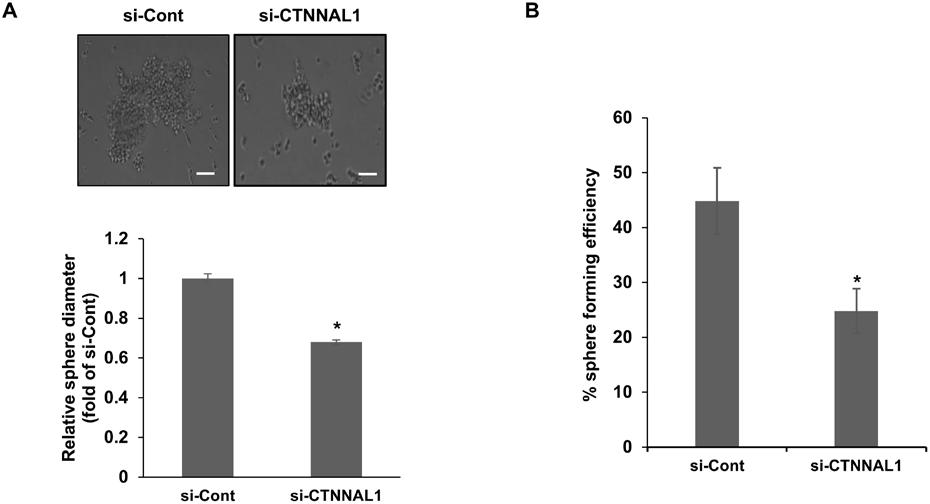
In the single-cell assay, sphere-forming efficiency decreased from approximately 44.8% in control cells to 24.8% following CTNNAL1 knockdown (Fig. 3B). Thus, reduced CTNNAL1 expression was associated with lower sphere-forming capacity under the conditions examined.
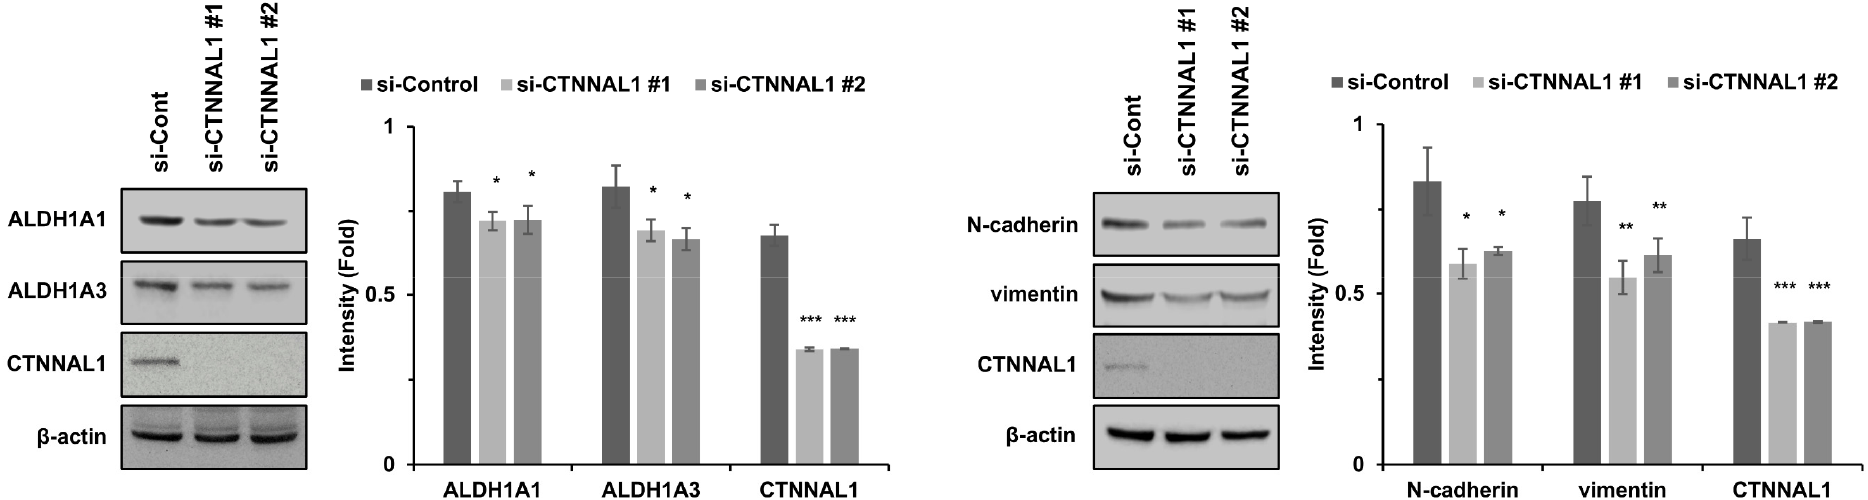
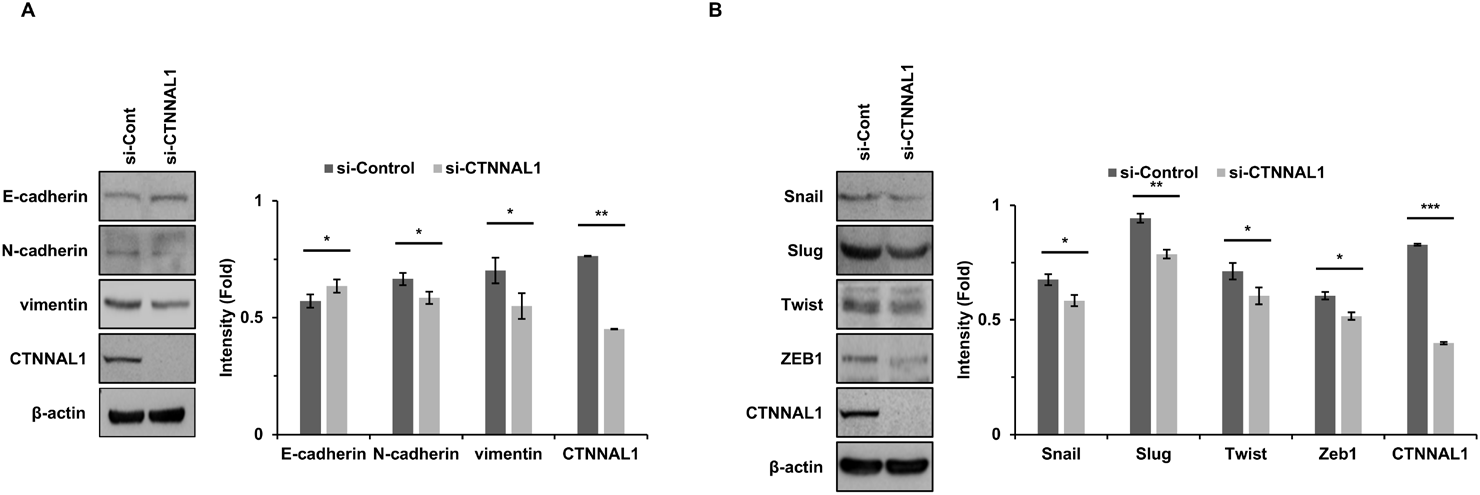
We next examined EMT-associated proteins following CTNNAL1 knockdown. E-cadherin expression increased, whereas N-cadherin and vimentin expression decreased in CTNNAL1-depleted cells (Fig. 4A). The EMT-associated transcription factors Snail, Slug, Twist, and ZEB1 were also reduced (Fig. 4B). Consistent with these findings, an independent CTNNAL1-targeting siRNA similarly reduced N-cadherin and vimentin expression (Supplementary Fig. 1B). These coordinated marker changes are consistent with attenuation of a mesenchymal-like protein expression pattern; however, they do not by themselves demonstrate completion or reversal of EMT.
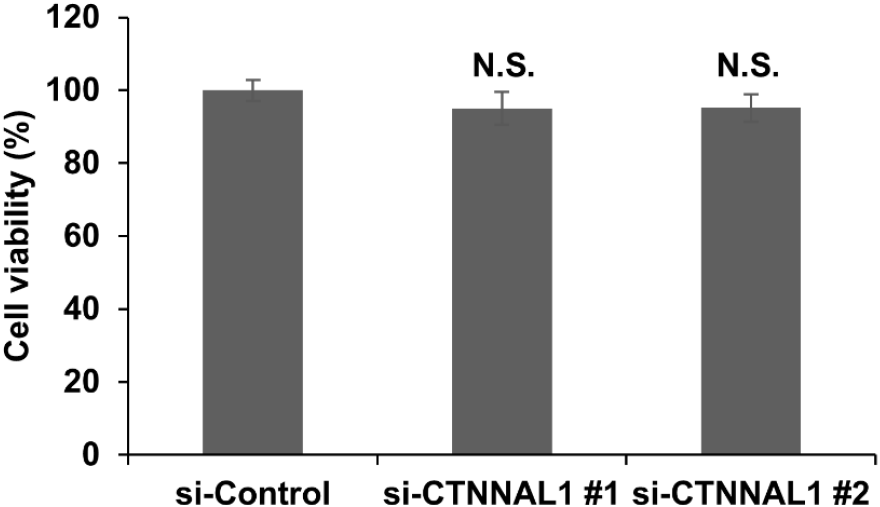
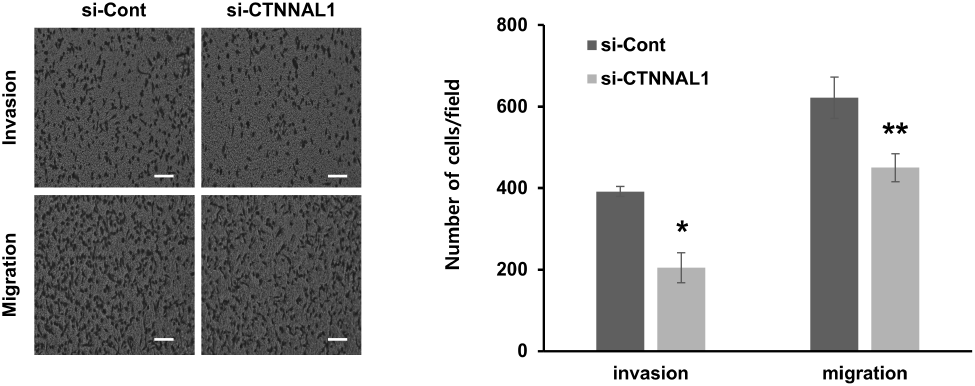
Transwell assays were performed to assess cellular migration and invasion in vitro. CTNNAL1 knockdown significantly reduced both migration and invasion of MDA-MB-231 cells compared with control siRNA-transfected cells (Fig. 5). To assess whether the observed phenotypic changes could be attributed to a general reduction in cell viability, cell viability was examined following CTNNAL1 knockdown. Neither of the two independent CTNNAL1-targeting siRNAs significantly affected cell viability under the experimental conditions examined (Supplementary Fig. 2). These findings suggest that the reductions in sphere-forming capacity, migration, and invasion were unlikely to be primarily attributable to a general loss of cell viability.
DISCUSSION
This study examined the relationship between CTNNAL1 and CSC-associated properties and EMT-associated phenotypes in MDA-MB-231 human breast cancer cells. CTNNAL1 expression increased under sphere-forming conditions together with CD44, ALDH1A1, and ALDH1A3. Conversely, siRNA-mediated CTNNAL1 depletion reduced CSC-associated proteins and stemness-associated transcription factors, decreased sphere-forming capacity, altered EMT-associated marker expression, and reduced migration and invasion. Taken together, these results suggest that CTNNAL1 is associated with several cellular phenotypes related to breast cancer cell plasticity.
Sphere-forming culture under serum-free conditions is commonly used to assess sphere-forming capacity and CSC-associated properties in vitro. The parallel increase in CTNNAL1 and CSC-associated markers under these conditions established an association but did not determine whether CTNNAL1 was functionally involved. The knockdown experiments provided additional evidence: decreases in CD44, ALDH1A1, ALDH1A3, Sox2, Oct4, and Nanog were accompanied by reduced sphere diameter and lower single-cell sphere-forming efficiency. These findings support an association between CTNNAL1 and CSC-like properties in MDA-MB-231 cells, but they do not establish tumor-initiating capacity, which would require in vivo limiting-dilution analysis.
The present results are consistent with a previous report in lung cancer and glioblastoma cells, in which CTNNAL1 knockdown reduced CSC-associated markers and sphere formation (Kahm et al., 2023). The similar direction of the effects across these cell models raises the possibility that CTNNAL1 participates in a broader cellular plasticity program. Importantly, selected changes in CSC-associated and EMT-associated markers were reproduced using a second independent CTNNAL1-targeting siRNA, supporting the reproducibility of the observed effects and reducing concerns related to the use of a single siRNA reagent. Nevertheless, the downstream pathways linking CTNNAL1 to these phenotypes remain unknown. Direct mechanistic experiments, including rescue with an siRNA-resistant CTNNAL1 construct and analysis of candidate signaling pathways, will be required to further establish CTNNAL1-specific effects and define the underlying molecular mechanisms.
CTNNAL1 knockdown also increased E-cadherin and decreased N-cadherin, vimentin, Snail, Slug, Twist, and ZEB1. Because MDA-MB-231 cells have a predominantly mesenchymal-like phenotype and relatively low basal E-cadherin expression, the modest increase in E-cadherin should be interpreted cautiously. The observed changes are most appropriately described as alterations in EMT-associated markers rather than definitive evidence of mesenchymal-to-epithelial transition. This distinction is important because EMT is dynamic and context dependent, and marker expression alone does not establish a complete phenotypic transition (Thiery et al., 2009; Nieto et al., 2016).
The reduction in migration and invasion provides functional support for the EMT-associated marker data. However, these Transwell assays measure cell movement through an artificial membrane in vitro and do not directly demonstrate metastatic dissemination. Moreover, migration and invasion can be affected by changes in cell viability, adhesion, or cytoskeletal organization. To assess whether a general reduction in cell viability could contribute to the observed phenotypic changes, cell viability was examined following CTNNAL1 knockdown. Neither of the two independent CTNNAL1-targeting siRNAs significantly affected cell viability under the experimental conditions examined. Thus, the reductions in sphere-forming capacity, migration, and invasion are unlikely to be primarily explained by a general loss of cell viability. Nevertheless, other factors, including changes in cell adhesion or cytoskeletal organization, may contribute to these phenotypes, and the underlying mechanisms remain to be determined.
Several limitations should be considered. First, the experiments were conducted in a single cell line, MDA-MB-231, and therefore cannot represent the biological heterogeneity of breast cancer or triple-negative breast cancer. Validation in additional breast cancer cell lines with different molecular characteristics will be required to determine the generalizability of these findings. Second, although selected changes in CSC-associated and EMT-associated markers were reproduced using a second independent CTNNAL1-targeting siRNA, rescue experiments were not performed, and therefore the specificity of the observed phenotypes cannot be fully established. Third, the study was limited to in vitro assays and did not examine tumor initiation, growth, or metastasis in vivo. Finally, the downstream molecular mechanisms linking CTNNAL1 depletion to the observed CSC- and EMT-associated phenotypes were not investigated. These limitations restrict the conclusions to the cellular phenotypes observed in MDA-MB-231 cells under the experimental conditions examined. In conclusion, CTNNAL1 expression was elevated under sphere-forming conditions, and CTNNAL1 knockdown reduced CSC-associated marker expression and sphere-forming capacity, altered EMT-associated marker expression, and reduced migration and invasion in MDA-MB-231 cells. These findings support an association between CTNNAL1 and CSC-associated properties and EMT-associated phenotypes in this cellular model. Additional cell models, rescue experiments, mechanistic studies, and in vivo validation will be required to determine the broader biological and clinical relevance of CTNNAL1 in breast cancer.